RAG

From Claude with some prompting
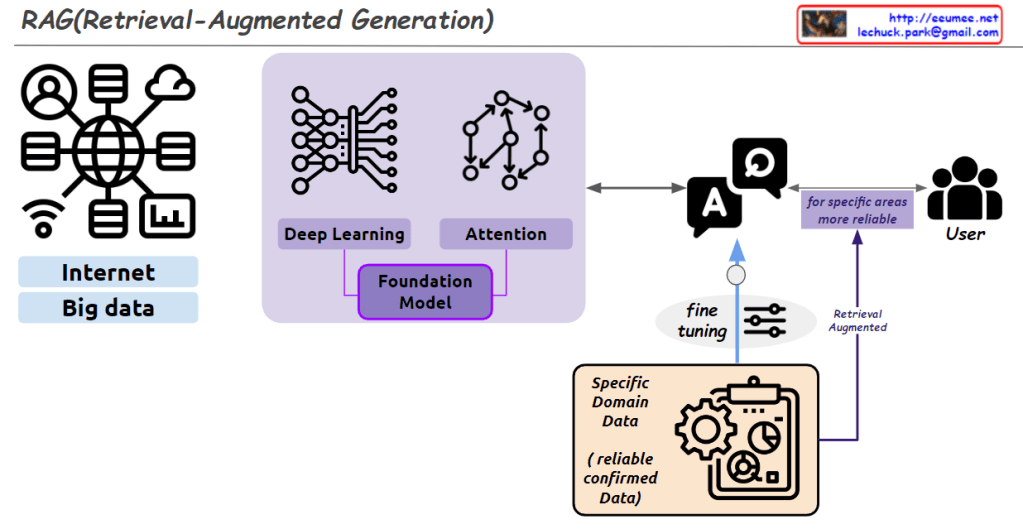
This image explains the concept and structure of the RAG (Retrieval-Augmented Generation) model.

First, a large amount of data is collected from the “Internet” and “Big Data” to train a Foundation Model. This model utilizes Deep Learning and Attention mechanisms.

Next, the Foundation Model is fine-tuned using reliable and confirmed data from a Specific Domain (Specific Domain Data). This process creates a model specialized for that particular domain.

Ultimately, this allows the model to provide more reliable responses to users in that specific area. The overall process is summarized by the concept of Retrieval-Augmented Generation.

The image visually represents the components of the RAG model and the flow of data through the system effectively.

Casting packet

from Claude with some prompting
This image illustrates the different types of network communication methods: Unicast, Multicast, Broadcast, and Anycast. Each method is represented by a visual diagram showing how data is transmitted from a source to specific targets or groups of targets within a network.

Unicast targets a specific IP address, sending data to a single destination. Multicast targets a specific IP group within one network, allowing data to be sent to multiple recipients simultaneously. Broadcast targets all IP addresses within a specific network, essentially sending data to every device on that network.

Anycast is slightly different, targeting a specific address but sending the data to the closest/nearest device with that address, as determined by the routing protocols and BGP (Border Gateway Protocol) peering.

The image provides a clear visual representation of these communication methods and their differences in terms of targeting and data distribution within networks.


AI operation By Humans

From Claude with some prompting
This image illustrates a process called “Data Center AI Operation by Humans (Experts).” It depicts the various stages involved in utilizing artificial intelligence (AI) to analyze and optimize data center operations while ensuring that human experts have the final decision-making authority.

The process starts with data collection from various sources like servers and automation systems. This data is then verified and converted into a digital format suitable for analysis by AI algorithms. The AI system performs analysis and generates insights, which are combined with the data center processes to suggest optimizations.

However, before implementing any changes, human experts knowledgeable in data and AI review and finalize all decisions. This approach aims to leverage AI’s analytical capabilities while maintaining human expertise and oversight for critical operational decisions in the data center.

The image emphasizes that while AI acts as an “accelerator” for digitalization and analysis, the ultimate operation is carried out by human experts who understand the nuances of data and AI to ensure effective and responsible decision-making.

CPU,FPGA,ASIC

From Claude with some prompting
The CPU is described as a central processing unit for general-purpose computing, handling diverse tasks with high performance but at a low cost/price ratio.

This image provides an overview of different types of processors and their key characteristics. It compares CPUs, ASICs (Application-Specific Integrated Circuits), FPGAs (Field-Programmable Gate Arrays), and GPUs (Graphics Processing Units).

The ASIC is an application-specific integrated circuit designed for specific tasks like cryptography and AI. It has low performance per price but is highly optimized for its intended use cases.

The FPGA is a reconfigurable processor that allows design changes and prototyping. It has medium performance per price and is suitable for data processing sequences.

The GPU is designed for graphic processing and parallel data processing. It excels at high-performance computing for graphics-intensive applications, but has a medium to high cost/price ratio.

The image highlights the key differences in terms of processing capability, specialization, reconfigurability, performance, and cost among these processor types.

The time ??

From Gemini with some prompting
The image depicts the concept of time and its relationship to matter, light, and change. Here’s a breakdown of the image elements:

  • Clock: Represents the measurement of time.
  • Atoms: Symbolize matter.
  • Sun: Represents light.
  • Rays of Light: Represent change.
  • Text: Includes explanations of time units, quantum, light, change, and the interconnectedness of everything.

Image Analysis

The image conveys that time is intricately intertwined with matter, light, and change. Time is used to measure the movement of matter and light, while change signifies the passage of time.

Text Analysis

  • “Time” clearly indicates the image’s subject matter.
  • “Standard” refers to the widely used system of time units.
  • “Standard???” suggests the existence of alternative time unit systems.
  • “Invisible” and “Can be seen” highlight the relativity of time. Time is not absolute but can be perceived differently depending on the observer’s perspective.
  • “Unit of change” emphasizes that time is a unit used to measure change.
  • “Quantum??” raises questions about the concept of time in quantum mechanics. In quantum mechanics, time is sometimes considered not continuous but composed of discrete units.
  • “Light” indicates the connection between light and time. The speed of light is a reference point for time measurement.
  • “Everything affects each other” signifies that time, matter, light, and change are interconnected.

Overall Interpretation

The image is a multifaceted representation of the complexity and diversity of time. It goes beyond time as a mere tool for counting numbers and delves into its profound relationship with matter, light, and change.

KASAN @ linux kernel

From Gemini with some prompting
The image you provided depicts a diagram illustrating the operation of Kernel Address Sanitizer (KASAN) in the Linux kernel. KASAN is a memory sanitizer tool that aims to detect memory corruption errors, particularly those related to out-of-bounds reads/writes and use-after-free vulnerabilities.

Key Elements of the Diagram:

  1. Memory Accessing: This section represents the various ways in which memory is accessed within the kernel. It includes both valid and invalid access patterns.
  2. For All Memory: This indicates that KASAN monitors memory accesses for all allocated memory regions, regardless of their purpose or usage.
  3. Shadow Memory: This represents a dedicated memory space, typically 1/8th of the total physical memory, allocated by KASAN to store information about memory accesses.
  4. Violation Detection: This section highlights the core function of KASAN, which is to detect and report invalid memory access attempts.
  5. Use-after-free Detection: This specifically refers to KASAN’s ability to identify attempts to access memory regions that have already been freed, preventing potential memory corruption issues.
  6. Out-of-Bounds Read/Write: This emphasizes KASAN’s capability to detect memory accesses that exceed the boundaries of the allocated memory regions, safeguarding against buffer overflows and other memory-related vulnerabilities.

Overall Interpretation:

The diagram effectively illustrates the fundamental concept of KASAN: monitoring memory accesses, maintaining a shadow memory space for access information, and detecting invalid access patterns to prevent memory corruption errors.