From DALL-E with some prompting The flowchart illustrates a four-step network anomaly detection process:
Data Collection: Gather various types of network data.
Protocol Usage: Employ SNMP, SFLOW/NETFLOW, and other methods to extract the data.
Analysis: Analyze Ethernet and TCP/IP header data for irregularities.
Control: Implement countermeasures like blocking traffic or controlling specific IP addresses.
The expected benefits of this process include enhanced network security through early detection of anomalies, the ability to prevent potential breaches by blocking suspicious traffic, and improved network management via real-time analysis and control.
+ 224.0.0.6 (All Designated Routers) : Designated Router (DR) and Backup Designated Router (BDR). It is utilized to optimize communication between the DR and BDR, and regular OSPF routers do not receive messages from this address.
From DALL-E with Some prompting The image is a visual representation of the operation of the OSPF (Open Shortest Path First) protocol. Here is the interpretation of each step depicted in the image:
get LS (Link State): OSPF routers collect cost values from all physically connected routers. This step involves determining the adjacency relationships between routers and the state of each link.
LSA (Link State Advertisement): Each router creates an LSA that contains its link-state information and disseminates it to other routers within the network. During this process, the multicast address 224.0.0.5 is used to broadcast the information to all OSPF routers.
LSDB (Link State Database): The information from the received LSAs is compiled into the LSDB of every OSPF router. This database should be identical across all routers within the Autonomous System (AS) and contains the complete topology information of the network.
Shortest Path Tree Calculation: Using the LSDB, each router calculates the shortest path tree from itself to all other destinations employing the Dijkstra algorithm. This calculation aids each router in determining the optimal routing paths.
Routing Table Update: The shortest path information calculated is then used to update the routing table of each router. This enables routers to forward packets using the optimal routes.
At the bottom, there’s a section titled Dynamic Updates, indicating that when there are changes in the network topology, new LSAs are generated and propagated through the network. This ensures that all routers’ LSDBs are updated and, as a result, the routing tables are also updated to reflect the new optimal routes.
In the top-right corner, it states “224.0.0.5 Broadcast IP for all OSPF router”, which indicates the multicast address used by all OSPF routers to receive LSA broadcasts.
This diagram provides a visual explanation of the core routing processes of OSPF, highlighting the mechanisms that enable efficient routing within the network and facilitate rapid convergence.
from DALL-E with some prompting The image seems to illustrate the concept of anomaly detection in network security. A user is shown with a green line leading to a server, indicating normal interaction, while a red line leading from a network criminal suggests malicious activity. The network architecture is in place to mirror and tap into the data traffic, allowing for the steering of packets for closer inspection. An alert (!!) signifies the detection of an anomaly. Below, details of what is monitored are given: raw or sampled packets, TCP/IP 5-tuples, geographic IP locations, bandwidth, and new detection areas including DNS and HTTP header information. This represents a multifaceted approach to identifying and responding to potential security threats within a network.
From DALL-E with some prompting The image appears to illustrate a concept related to network dynamics, specifically how a minority within a network can gain influence or power. It shows a progression of three stages:
A central node with uniform connections around it, representing an initial state of a network.
The same network, but with the central node now having a dashed outline, possibly indicating the beginning of a decentralization process or the distribution of control.
In the final stage, two nodes labeled “Min” are highlighted, suggesting that these minority nodes have gained significant influence within the network. The question “Bad Minority??” implies a potential concern about the intentions or impact of this empowered minority.
The overarching message could be about the changing nature of influence in increasingly shared, Internet-enabled, and distributed networks, and the potential for smaller or previously less influential actors to become powerful, with an open question about whether this influence is positive or negative.
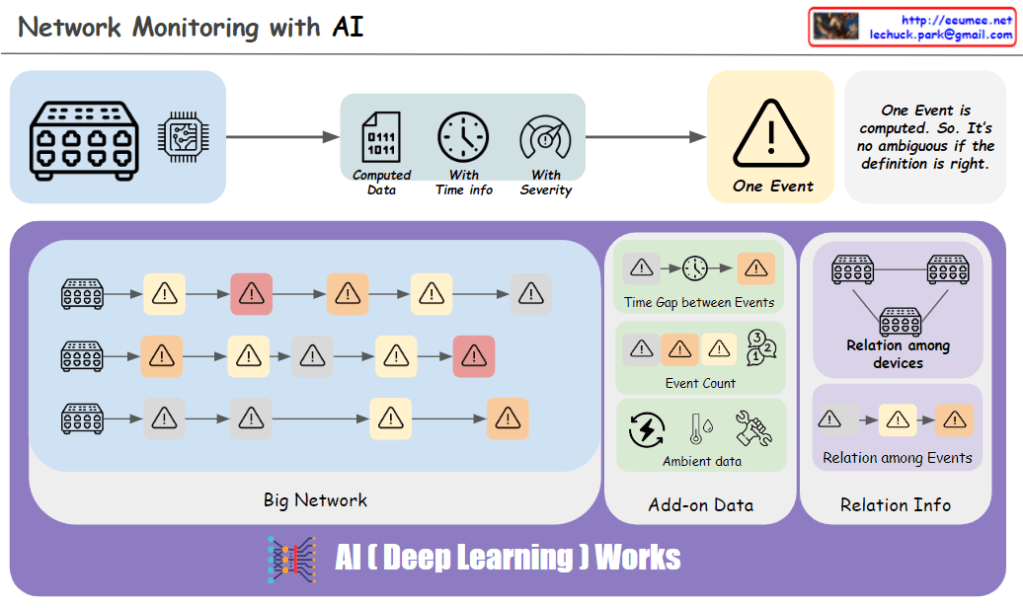
from DALL-E with some prompting The image portrays a network monitoring system enhanced by AI, specifically utilizing deep learning. It shows a flow from the network infrastructure to the identification of an event, characterized by computed data with time information and severity. The “One Event” is clearly defined to avoid ambiguity. The system identifies patterns such as the time gap between events, event count, and relationships among devices and events, which are crucial for a comprehensive network analysis. AI deep learning algorithms work to process additional data (add-on data) and ambient data to detect anomalies and support predictive maintenance within the network.
From DALL-E with some prompting The image delineates the foundational aspects of network switching and routing based on their origins. Switching, historically in LANs, involved the broadcasting of packets, which modern switches now intelligently direct or block based on MAC addresses and VLAN information. Routing originally functioned to determine packet pathways over networks using IP address information. While these were once discrete tasks performed by separate devices, contemporary network technology often integrates both functions within the same hardware, allowing switches to perform some routing tasks and vice versa, reflecting the evolution and convergence of networking equipment.