From RNN to Transformer

Visual Analysis: RNN vs Transformer

Visual Structure Comparison

RNN (Top): Sequential Chain

  • Linear flow: Circular nodes connected left-to-right
  • Hidden states: Each node processes sequentially
  • Attention weights: Numbers (2,5,11,4,2) show token importance
  • Bottleneck: Must process one token at a time

Transformer (Bottom): Parallel Grid

  • Matrix layout: 5×5 grid of interconnected nodes
  • Self-attention: All tokens connect to all others simultaneously
  • Multi-head: 5 parallel attention heads working together
  • Position encoding: Separate blue boxes handle sequence order

Key Visual Insights

Processing Pattern

  • RNN: Linear chain → Sequential dependency
  • Transformer: Interconnected grid → Parallel freedom

Information Flow

  • RNN: Single path with accumulating states
  • Transformer: Multiple simultaneous pathways

Attention Mechanism

  • RNN: Weights applied to existing sequence
  • Transformer: Direct connections between all elements

Design Effectiveness

The diagram succeeds by using:

  • Contrasting layouts to show architectural differences
  • Color coding to highlight attention mechanisms
  • Clear labels (“Sequential” vs “Parallel Processing”)
  • Visual metaphors that make complex concepts intuitive

The grid vs chain visualization immediately conveys why Transformers enable faster, more scalable processing than RNNs.

Summary

This diagram effectively illustrates the fundamental shift from sequential to parallel processing in neural architecture. The visual contrast between RNN’s linear chain and Transformer’s interconnected grid clearly demonstrates why Transformers revolutionized AI by enabling massive parallelization and better long-range dependencies.

With Claude
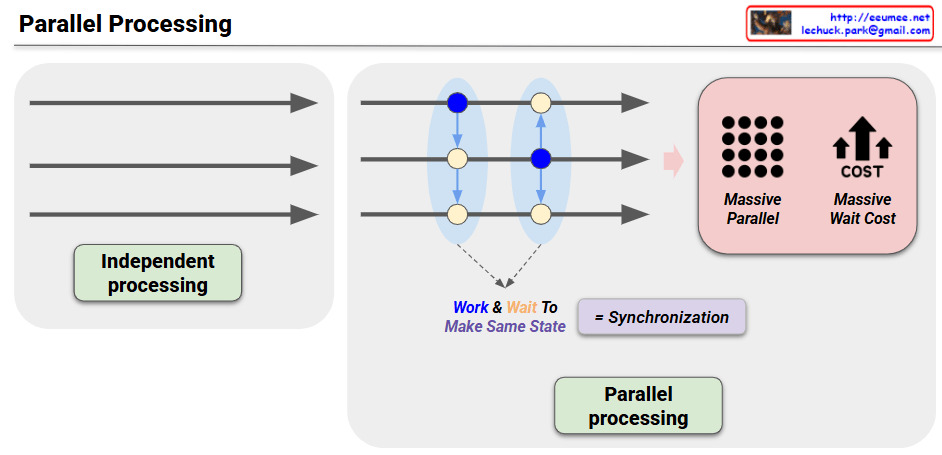
Parallel Processing

Parallel Processing System Analysis

System Architecture

1. Input Stage – Independent Processing

  • Multiple tasks are simultaneously input into the system in parallel
  • Each task can be processed independently of others

2. Central Processing Network

Blue Nodes (Modification Work)

  • Processing units that perform actual data modifications or computations
  • Handle parallel incoming tasks simultaneously

Yellow Nodes (Propagation Work)

  • Responsible for propagating changes to other nodes
  • Handle system-wide state synchronization

3. Synchronization Stage

  • Objective: “Work & Wait To Make Same State”
  • Wait until all nodes reach identical state
  • Essential process for ensuring data consistency

Performance Characteristics

Advantage: Massive Parallel

  • Increased throughput through large-scale parallel processing
  • Reduced overall processing time by executing multiple tasks simultaneously

Disadvantage: Massive Wait Cost

  • Wait time overhead for synchronization
  • Entire system must wait for the slowest node
  • Performance degradation due to synchronization overhead

Key Trade-off

Parallel processing systems must balance performance enhancement with data consistency:

  • More parallelism = Higher performance, but more complex synchronization
  • Strong consistency guarantee = Longer wait times, but stable data state

This concept is directly related to the CAP Theorem (Consistency, Availability, Partition tolerance), which is a fundamental consideration in distributed system design.

With Claude

“Vectors” than definitions.

This image visualizes the core philosophy that “In the AI era, vector-based thinking is needed rather than simplified definitions.”

Paradigm Shift in the Upper Flow:

  • Definitions: Traditional linear and fixed textual definitions
  • Vector: Transformation into multidimensional and flexible vector space
  • Context: Structure where clustering and contextual relationships emerge through vectorization

Modern Approach in the Lower Flow:

  1. Big Data: Complex and diverse forms of data
  2. Machine Learning: Processing through pattern recognition and learning
  3. Classification: Sophisticated vector-based classification
  4. Clustered: Clustering based on semantic similarity
  5. Labeling: Dynamic labeling considering context

Core Insight: In the AI era, we must move beyond simplistic definitional thinking like “an apple is a red fruit” and understand an apple as a multidimensional vector encompassing color, taste, texture, nutritional content, cultural meaning, and more. This vector-based thinking enables richer contextual understanding and flexible reasoning, allowing us to solve complex real-world problems more effectively.

Beyond simple classification or definition, this presents a new cognitive paradigm that emphasizes relationships and context. The image advocates for a fundamental shift from rigid categorical thinking to a nuanced, multidimensional understanding that better reflects how modern AI systems process and interpret information.

With Claude

Temperate Prediction in DC (II) – The start and The Target

This image illustrates the purpose and outcomes of temperature prediction approaches in data centers, showing how each method serves different operational needs.

Purpose and Results Framework

CFD Approach – Validation and Design Purpose

Input:

  • Setup Data: Physical infrastructure definitions (100% RULES-based)
  • Pre-defined spatial, material, and boundary conditions

Process: Physics-based simulation through computational fluid dynamics

Results:

  • What-if (One Case) Simulation: Theoretical scenario testing
  • Checking a Limitation: Validates whether proposed configurations are “OK or not”
  • Used for design validation and capacity planning

ML Approach – Operational Monitoring Purpose

Input:

  • Relation (Extended) Data: Real-time operational data starting from workload metrics
  • Continuous data streams: Power, CPU, Temperature, LPM/RPM

Process: Data-driven pattern learning and prediction

Results:

  • Operating Data: Real-time operational insights
  • Anomaly Detection: Identifies unusual patterns or potential issues
  • Used for real-time monitoring and predictive maintenance

Key Distinction in Purpose

CFD: “Can we do this?” – Validates design feasibility and limits before implementation

  • Answers hypothetical scenarios
  • Provides go/no-go decisions for infrastructure changes
  • Design-time tool

ML: “What’s happening now?” – Monitors current operations and predicts immediate future

  • Provides real-time operational intelligence
  • Enables proactive issue detection
  • Runtime operational tool

The diagram shows these are complementary approaches: CFD for design validation and ML for operational excellence, each serving distinct phases of data center lifecycle management.

With Claude

Temperate Prediction in DC

Overall Structure

Top: CFD (Computational Fluid Dynamics) based approach Bottom: ML (Machine Learning) based approach

CFD Approach (Top)

  • Basic Setup:
    • Spatial Definition & Material Properties: Physical space definition of the data center and material characteristics (servers, walls, air, etc.)
    • Boundary Conditions: Setting boundary conditions (inlet/outlet temperatures, airflow rates, heat sources, etc.)
  • Processing:
    • Configuration + Physical Rules: Application of physical laws (heat transfer equations, fluid dynamics equations, etc.)
    • Heat Flow: Heat flow calculations based on defined conditions
  • Output: Heat + Air Flow Simulation (physics-based heat and airflow simulation)

ML Approach (Bottom)

  • Data Collection:
    • Real-time monitoring through Metrics/Data Sensing
    • Operational data: Power (Kw), CPU (%), Workload, etc.
    • Actual temperature measurements through Temperature Sensing
  • Processing: Pattern learning through Machine Learning algorithms
  • Output: Heat (with Location) Prediction (location-specific heat prediction)

Key Differences

CFD Method: Theoretical calculation through physical laws using physical space definitions, material properties, and boundary conditions as inputs ML Method: Data-driven approach that learns from actual operational data and sensor information for prediction

The key distinction is that CFD performs simulation from predefined physical conditions, while ML learns from actual operational data collected during runtime to make predictions.

With Claude

Learning , Reasoning, Inference

This image illustrates the three core processes of AI LLMs by drawing parallels to human learning and cognitive processes.

Learning

  • Depicted as a wise elderly scholar reading books in a library
  • Represents the lifelong process of absorbing knowledge and experiences accumulated by humanity over generations
  • The bottom icons show data accumulation and knowledge storage processes
  • Meaning: Just as AI learns human language and knowledge through vast text data, humans also build knowledge throughout their lives through continuous learning and experience

Reasoning

  • Shows a character deep in thought, surrounded by mathematical formulas
  • Represents the complex mental process of confronting a problem and searching for solutions through internal contemplation
  • The bottom icons symbolize problem analysis and processing stages
  • Meaning: The human cognitive process of using learned knowledge to engage in logical thinking and analysis to solve problems

Inference

  • Features a character confidently exclaiming “THE ANSWER IS CLEAR!”
  • Expresses the confidence and decisiveness when finally finding an answer after complex thought processes
  • The bottom checkmark signifies reaching a final conclusion
  • Meaning: The human act of ultimately speaking an answer or making a behavioral decision through thought and analysis

These three stages visually demonstrate how AI processes information in a manner similar to the natural human sequence of learning → thinking → conclusion, connecting AI’s technical processes to familiar human cognitive patterns.

With Claude

Prediction with data

This image illustrates a comparison between two approaches for Prediction with Data.

Left Side: Traditional Approach (Setup First Configuration)

The traditional method consists of:

  • Condition: 3D environment and object locations
  • Rules: Complex physics laws
  • Input: 1+ cases
  • Output: 1+ prediction results

This approach relies on pre-established rules and physical laws to make predictions.

Right Side: Modern AI/Machine Learning Approach

The modern method follows these steps:

  1. Huge Data: Massive datasets represented in binary code
  2. Machine Learning: Pattern learning from data
  3. AI Model: Trained artificial intelligence model
  4. Real-Time High Resolution Data: High-quality data streaming in real-time
  5. Prediction Anomaly: Final predictions and anomaly detection

Key Differences

The most significant difference is highlighted by the question “Believe first ??” at the bottom. This represents a fundamental philosophical difference: the traditional approach starts by “believing” in predefined rules, while the AI approach learns patterns from data to make predictions.

Additionally, the AI approach features “Longtime Learning Verification,” indicating continuous model improvement through ongoing learning and validation processes.

The diagram effectively contrasts rule-based prediction systems with data-driven machine learning approaches, showing the evolution from deterministic, physics-based models to adaptive, learning-based AI systems.

With Claude