Before & Optimization

From Claude with some prompting
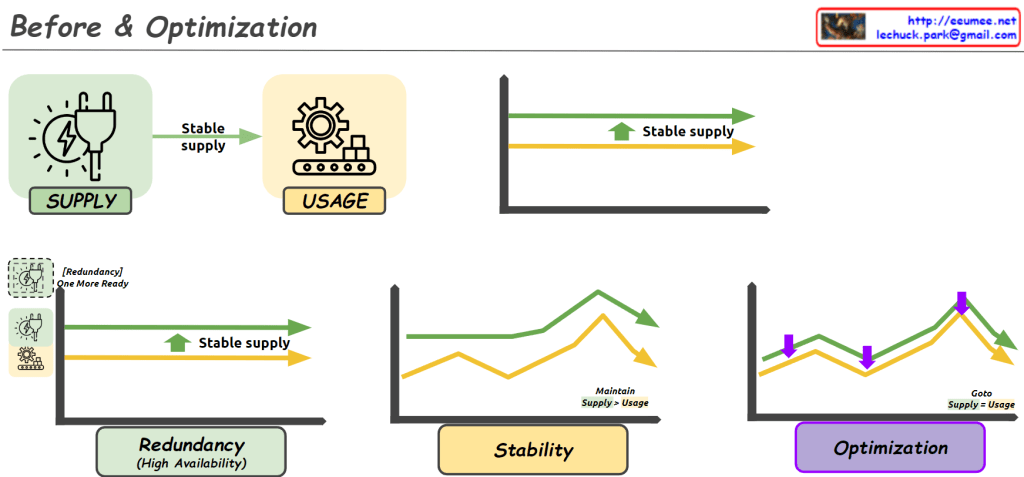
This image illustrates the process of “Before & Optimization” in a system, divided into three main stages:

  1. Initial State:
    • Shows “Supply” and “Usage” components.
    • Demonstrates a stable supply flowing to usage.
    • The graph indicates supply maintaining slightly above usage.
  2. Intermediate Stage:
    • Introduces “Redundancy (High Availability)”.
    • An additional supply unit labeled “One More Ready” is added.
    • The “Stability” graph shows supply consistently higher than usage, with the note “Maintain Supply > Usage”.
  3. Final Optimization Stage:
    • The “Optimization” graph shows supply and usage being closely aligned.
    • Purple arrows indicate adjustments to match supply with usage.
    • Labeled “Goto Supply = Usage”, showing the goal of matching supply to usage.

Overall, this image depicts the progression from ensuring stable supply, through adding redundancy for increased stability, to finally optimizing the system by matching supply closely with usage. It demonstrates the process of maintaining system stability while improving efficiency.

Automation System

From Claude with some prompting
This image illustrates an Automation process, consisting of two main parts:

  1. Upper section:
    • Shows a basic automation process consisting of Condition and Action.
    • Real Data (Input) and Real Plan (Output) are fed into a Software System.
  2. Lower section:
    • Depicts a more complex automation process.
    • Alternates between manual operations (hand holding hammer icon) and software systems (screen with gear icon).
    • This represents the integration of manual tasks and automated systems.
    • Key features of the process:
      • Use of Accurate Verified Data
      • 24/7 Stable System operation
      • Continuous Optimization
    • Results: More Efficient process with Cost & Resource reduction

The hammer icon represents manual interventions, working in tandem with automated software systems to enhance overall process efficiency. This approach aims to achieve optimal results by combining human involvement with automation systems.

The image demonstrates how automation integrates real-world tasks with software systems to increase efficiency and reduce costs and resources.

Connections of minorities

From Claude with some prompting
The image titled “Connections of minorities” compares “Before” and “Now” scenarios:

“Before”:

  • Large blue circles (representing the majority) are connected and growing.
  • Small black circles (representing minorities) are isolated.
  • Caption: “Only the majority connects and grows.”

“Now”:

  • Large blue circles remain connected, but small black circles start connecting.
  • New large black circles appear, connecting the minorities.
  • Caption: “Minorities also can make connections.”

A central element labeled “Data Collector (Internet)” and “AI Data Processor” suggests these changes are due to internet and AI technology advancements.

The bottom asks: “The Minor is Good or Bad???, The Major also”. This prompts consideration of whether increased connections for minorities and majorities are positive or negative.

Overall, the image illustrates how technological progress has provided minorities with more opportunities for connection, and invites reflection on the implications of these changes.CopyRet

Real

From Claude with some prompting
This diagram illustrates the process of human understanding of reality, highlighting the potential discrepancy between “Real Existence” and “Human Real”. The flow chart demonstrates:

  1. REAL EXISTENCE: Represents the objective reality, including the universe and all its phenomena.
  2. Energy Movement: Symbolizes the physical processes occurring in reality.
  3. Sensing: The stage where human sensory organs collect information, albeit in a limited capacity.
  4. Observation: Involves “Sampling”, indicating that we only perceive and process a fraction of reality.
  5. Human Knowledge: Represents the subjective understanding formed based on observed information.

This process underscores a crucial philosophical and epistemological issue: the gap between objective reality and human perception of reality. Humans are constrained by their sensory capabilities and observational methods, leading to a potentially incomplete or distorted understanding of the true nature of existence.

The diagram implies that what we consider “real” may differ significantly from absolute reality due to the limitations of human perception and cognition. This concept is fundamental in various fields, including philosophy, science, and epistemology, challenging our assumptions about knowledge and truth.

This perspective emphasizes the inherent limitations of human understanding and suggests that our perception of reality is inevitably filtered and potentially biased by our cognitive processes and sensory limitations.