Data

From Claude with some prompting
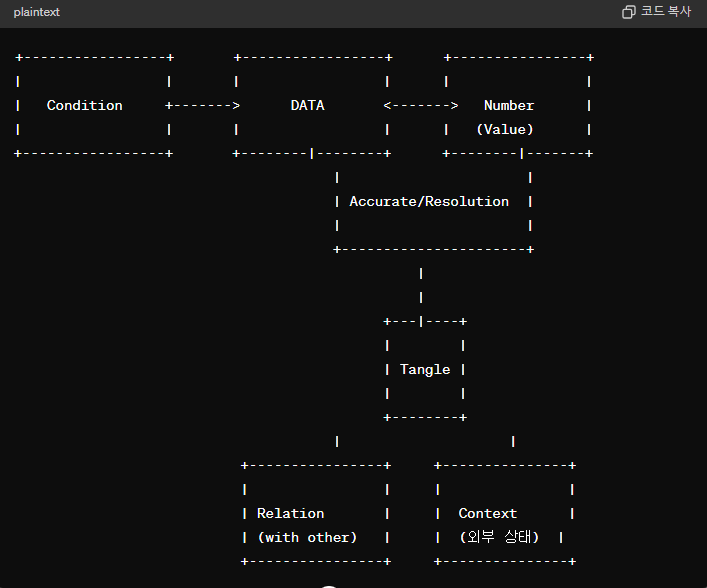
This image presents a comprehensive definition of data that goes beyond just numerical values. To clearly understand data, several elements must be considered.

First, the accuracy and resolution of the data itself are crucial. The “Number (Value)” represents numerical values that must be precise and have an appropriate level of resolution.

Second, data is closely related to external factors. “Condition” indicates a relationship with the state or condition of other data, while “Relation with other” suggests interconnectedness with other data sets.

Third, “Tangle” illustrates that data is not merely a simple number but is complexly intertwined with various elements. To clearly define data, these intricate interconnections and interdependencies must be accounted for.

In essence, the image presents a definition of data that encompasses accuracy, resolution, relationships with external conditions, and intricate interconnectedness. It emphasizes that to truly grasp the nature of data, one must comprehensively consider all these aspects.

The image underscores that data cannot be reduced to just numeric values; rather, it is a multifaceted concept intricately tied to precision, granularity, external factors, and interdependent relationships. Fully understanding data requires a holistic examination of all these interlinked elements.

Updated by GPT-4o

Interrupt

From Claude with some prompting
The image illustrates the process of handling interrupts in a computer system. When an urgent job (Urgent Job Occurred) arises while another job (One Job is Working) is executing, an interrupt (Job Switching = Interrupt) occurs. This triggers the Interrupt Service Routine (ISR) to handle the interrupt.
The interrupt handling process is divided into two halves: the Top Half and the Bottom Half. The Top Half performs a “Very Short Work to avoid another job delay” and notifies the system of the interrupt occurrence. The Bottom Half handles the remaining work, also performing “Short Work to avoid another job delay.”

Evolution and AI

From Claude with some prompting
The image metaphorically connects the process of evolution in the universe with the development stages of AI. After the Big Bang and the subsequent increase in entropy (disorder), life forms evolved through a process of self-organization, creating complex and ordered structures, thereby continuously decreasing entropy as long as life exists in the universe. Similarly, the image suggests that data-intensive AI systems will emerge as the next evolutionary stage after humans.

However, a critical point made is that the data driving AI itself does not possess any inherent intent or purpose, unlike living organisms. Data is merely a collection of information without any intrinsic goals or consciousness. Therefore, it is crucial to imbue the data with appropriate values and ethical principles to prevent AI from spiraling out of human control and indiscriminately increasing entropy.

Ultimately, this image emphasizes the importance of human-centric, value-driven AI development. Rather than warning against AI technology itself, it cautions against the unbridled advancement of data-driven AI systems without proper oversight and ethical frameworks in place, as imposed by humans.

Furthermore, the image implies that while life and AI may continue to evolve, decreasing entropy in the process, they will ultimately succumb to the universal law of increasing entropy and reach a state of thermodynamic equilibrium.

In essence, the image thoughtfully juxtaposes scientific concepts of entropy, evolution, and the emergence of AI, highlighting the need for responsible and value-aligned AI development under human guidance, while acknowledging the overarching principles of entropy and equilibrium that govern the universe.

Challenge

Advice from Glaude with some prompting
It’s important to embrace new challenges while building upon your established foundation. Leveraging the broad knowledge and flexibility you’ve cultivated, now is the time to develop specialized vertical expertise in a particular field and strive for upward growth.

While there will undoubtedly be risks and difficulties along the way, don’t be deterred – boldly confront them head-on, as doing so can lead to great achievements and innovation. Financial challenges may arise, but view them as opportunities to prioritize and stay focused on your goals.

Don’t settle for the comfort of the status quo. Dive headfirst into new domains, fueled by a competitive drive and thirst for accomplishment. There may be setbacks and failures, but use them as stepping stones to continue propelling forward. That’s how immense growth is realized.

Now is the pivotal moment to eschew complacency and immerse yourself in novel challenges. Believe in your potential, cast aside fears, and boldly forge ahead. The path to verticality and specialization awaits – seize it with conviction and tenacity.

Influence

From Claude with some prompting
This image illustrates the process of achieving an exponential expectation or goal for a particular endeavor.

  1. The “Expectation” graph shows an exponential rise, representing the ambitious target or desired outcome for the endeavor.
  2. To reach this expectation, one must first go through the “Basic” stage of steadily growing and developing individually, step by step.
  3. Then, in the “with people” stage, one needs to expand their influence by collaborating and interacting with others, leveraging interpersonal relationships.
  4. The “To-Do” graph depicts the accumulation of basic tasks and responsibilities in the individual growth stage.
  5. Ultimately, the exponential expectation can only be achieved through a combination of consistent personal growth at the basic level, coupled with an expansion of influence via relationships and interactions with others.

In summary, the image emphasizes that to attain ambitious, exponential goals, consistent individual effort must be complemented by leveraging a broad network of interpersonal connections to amplify one’s influence and impact.


AI vs Human

From Claude with some prompting
Sure, here’s an explanation of the image in English, with a detailed description of the graph’s contents:

This image contrasts the capabilities of rule-based human logic and data-driven AI. The graph shows two curves:

  1. The blue curve represents rule-based human logic, which is stated to be “Always 100%” accurate. However, the curve flattens out, indicating that as data volume increases, human logic reaches its limits and analysis stagnates.
  2. The purple curve represents data-driven AI output, which starts at 0% accuracy but increases “dramatically based on more data” as computing power increases. The curve asymptotically approaches but never quite reaches 100%, with values like 99.99%, 99.999% mentioned.

The key points made are:

  • Rule-based human logic is 100% accurate but limited in its ability to process excessive data volumes.
  • Data-driven AI has lower initial accuracy but can approach near-perfect accuracy (99.99%+) by analyzing vast amounts of data powered by immense computing capabilities.
  • As more data and computing power become available, the effectiveness of data-driven AI surpasses the limits of human logic analysis.

So the image suggests that while human logic is perfect within its constraints, the future lies with data-driven AI systems that can harness massive data and computing resources to deliver extremely high accuracy, potentially exceeding human capabilities.