Why/When Optimization ??

Analysis of Optimization Strategy Framework

Upper Graph: Stable Requirements Environment

  • Characteristics: Predictable requirements with minimal fluctuation
  • 100% Optimization Results:
    • “Very Difficult” (high implementation cost)
    • “No Efficiency” (poor ROI)
  • Conclusion: Over-optimization is unnecessary in stable environments

Lower Graph: Volatile Requirements Environment

  • Characteristics: Frequent requirement changes with high uncertainty
  • Optimization Level Analysis:
    • Peak Support (Blue): Reactive approach handling only maximum loads
    • 60-80% Optimization (Green): “Easy & High Efficiency”
    • 100% Optimization (Red): “Very Difficult” + “Still No Efficiency”

Key Insights

1. 60-80% Optimization as the Sweet Spot

  • Easy to achieve with reasonable effort
  • High efficiency in terms of cost-benefit ratio
  • Realistic and practical range for most business contexts

2. Environment-Specific Optimization Strategy

Stable Environment → Minimal optimization sufficient
Volatile Environment → 60-80% optimization optimal

3. The 100% Optimization Trap

  • Universally inefficient across all environments
  • Very difficult to achieve with no efficiency gains
  • Classic example of over-engineering

Practical Application Guide

60% Level: Minimum Professional Standard

  • MVP releases
  • Time-constrained projects
  • Experimental features

70% Level: General Target

  • Standard business products
  • Most commercial services
  • Typical quality benchmarks

80% Level: High-Quality Standard

  • Core business functions
  • Customer-facing critical services
  • Brand-value related elements

Business Implementation Framework

For Stable Environments:

  • Focus on basic functionality
  • Avoid premature optimization
  • Maintain simplicity

For Volatile Environments:

  • Target 60-80% optimization range
  • Prioritize adaptability over perfection
  • Implement iterative improvements

Conclusion: Philosophy of Practical Optimization

This framework demonstrates that “good enough” often outperforms “perfect” in real-world scenarios. The 60-80% optimization zone represents the intersection of achievability, efficiency, and business value—particularly crucial in today’s rapidly changing business landscape. True optimization isn’t about reaching 100%; it’s about finding the right balance between effort invested and value delivered, while maintaining the agility to adapt when requirements inevitably change.
(!) 60-80% is just a number. The best number is changed by …
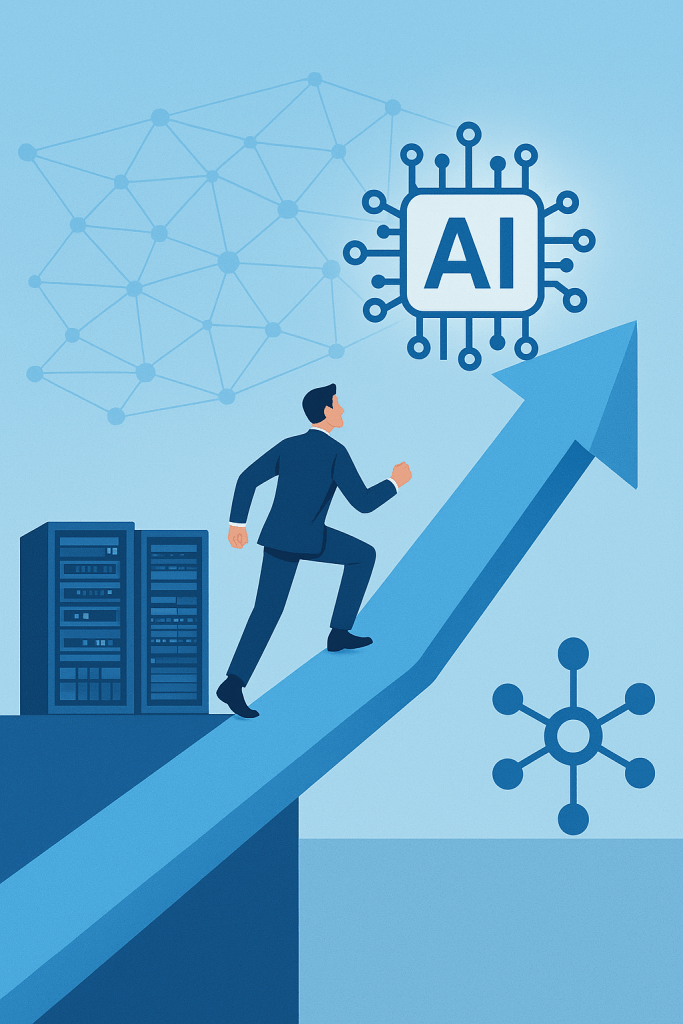
With Claude

HOPE OF THE NEXT

Hope to jump

This image visualizes humanity’s endless desire for ‘difference’ as the creative force behind ‘newness.’ The organic human brain fuses with the logical AI circuitry, and from their core, a burst of light emerges. This light symbolizes not just the expansion of knowledge, but the very moment of creation, transforming into unknown worlds and novel concepts.

Human-AI Collaborative Reasoning

This image illustrates the collaborative problem-solving process between humans and AI through reasoning, emphasizing their complementary relationship rather than a simple comparison.

Key Components and Interpretation

1. AI’s Operational Flow (Upper Section)

  • Big Data → Learning → AI Model: The process by which AI builds models through learning from vast amounts of data
  • Reasoning → Inferencing → Answer: The process by which AI receives questions and generates answers through reasoning

2. Human Role (Lower Section)

  • Experience: Knowledge and information acquired through direct experience
  • Logic: A logical thinking framework built upon experience
  • Reasoning: The cognitive process that combines experience and logic

3. Critical Interaction Mechanisms

Question:

  • Human reasoning results are input to AI in the form of sophisticated questions
  • These are not simple queries, but systematic and meaningful questions based on experience and logic

Answer:

  • AI’s responses are fed back into the human reasoning process
  • Humans verify AI’s answers and integrate them into new experiences and logic for deeper reasoning

4. Core Message

The red-highlighted phrase “humans must possess a strong, experience-based logical framework” represents the diagram’s central theme:

  • To collaborate effectively with AI, humans must also possess strong logical thinking frameworks based on experience
  • The ability to provide appropriate questions and properly verify and utilize AI’s responses is essential

Conclusion

This image demonstrates that human roles do not disappear in the AI era, but rather become more crucial. Human reasoning abilities based on experience and logic play a pivotal role in AI collaboration, and through this, humans and AI can create synergy for better problem-solving. The diagram presents a collaborative model where both entities work together to achieve superior results.

The key insight is that AI advancement doesn’t replace human thinking but rather requires humans to develop stronger reasoning capabilities to maximize the potential of human-AI collaboration.

With Claude, Gemini

FROM DIFFERENCES

This diagram illustrates the journey of recognizing and encoding “difference,” moving from philosophical thought to technological realization and finally AI. Ultimately, humans are beings who explain and create meaning, while AI is a system that calculates and processes patterns.

Operations : Changes Detection and then

Process Analysis from “Change Drives Operations” Perspective

Core Philosophy

“No Change, No Operation” – This diagram illustrates the fundamental IT operations principle that operations are driven by change detection.

Change-Centric Operations Framework

1. Change Detection as the Starting Point of All Operations

  • Top-tier monitoring systems continuously detect changes
  • No Changes = No Operations (left gray boxes)
  • Change Detected = Operations Initiated (blue boxes)

2. Operational Strategy Based on Change Characteristics

Change Detection → Operational Need Assessment → Appropriate Response
  • Normal Changes → Standard operational activities
  • Anomalies → Immediate response operations
  • Real-time Events → Emergency operational procedures

3. Cyclical Structure Based on Operational Outcomes

  • Maintenance: Stable operations maintained through proper change management
  • Fault/Big Cost: Increased costs due to inadequate response to changes

Key Insights

“Change Determines Operations”

  1. System without change = No intervention required
  2. System with change = Operational activity mandatory
  3. Early change detection = Efficient operations
  4. Proper change classification = Optimized resource allocation

Operational Paradigm

This diagram demonstrates the evolution from Reactive Operations to Proactive Operations, where:

  • Traditional Approach: Wait for problems → React
  • Modern Approach: Detect changes → Predict → Respond proactively

The framework recognizes change as the trigger for all operational activities, embodying the contemporary IT operations paradigm where:

  • Operations are event-driven rather than schedule-driven
  • Intelligence (AI/Analytics) transforms raw change data into actionable insights
  • Automation ensures appropriate responses to different types of changes

This represents a shift toward Change-Driven Operations Management, where the operational workload directly correlates with the rate and nature of system changes, enabling more efficient resource utilization and better service reliability.

With Claude