This image contrasts traditional programming, where developers must explicitly code rules and logic (shown with a flowchart and a thoughtful programmer), with AI, where neural networks automatically learn patterns from large amounts of data (depicted with a network diagram and a smiling programmer). It illustrates the paradigm shift from manually defining rules to machines learning patterns autonomously from data.
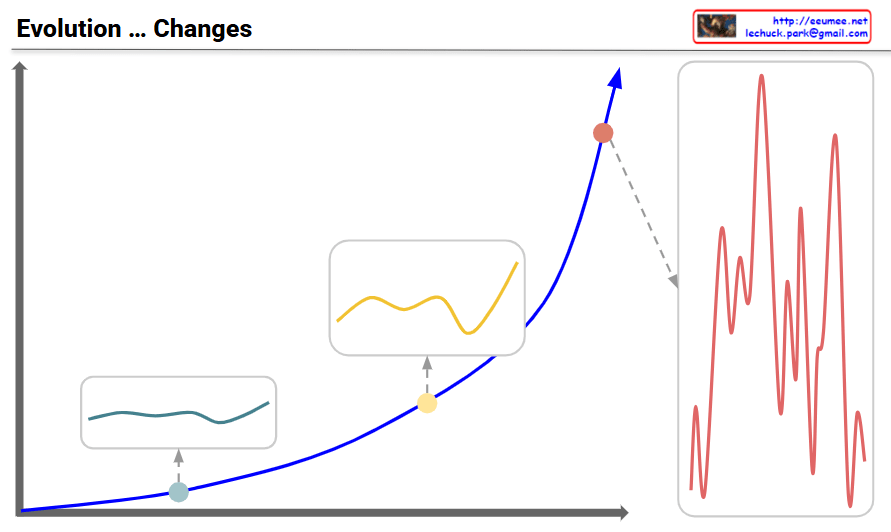
Evolution and Changes: Navigating Through Transformation
Overview:
Main Graph (Blue Curve)
Shows the pattern of evolutionary change transitioning from gradual growth to exponential acceleration over time
Three key developmental stages are marked with distinct points
Three-Stage Development Process:
Stage 1: Initial Phase (Teal point and box – bottom left)
Very gradual and stable changes
Minimal volatility with a flat curve
Evolutionary changes are slow and predictable
Response Strategy: Focus on incremental improvements and stable maintenance
Stage 2: Intermediate Phase (Yellow point and box – middle)
Fluctuations begin to emerge
Volatility increases but remains limited
Transitional period showing early signs of change
Response Strategy: Detect change signals and strengthen preparedness
Stage 3: Turbulent Phase (Red point and box on right – top)
Critical turning point where exponential growth begins
Volatility maximizes with highly irregular and large-amplitude changes
The red graph on the right details the intense and frequent fluctuations during this period
Characterized by explosive and unpredictable evolutionary changes
Response Imperative: Rapid and flexible adaptation is essential for survival in the face of high volatility and dramatic shifts
Key Message:
Evolution progresses through stable initial phases → emerging changes in the intermediate period → explosive transformation in the turbulent phase. During the turbulent phase, volatility peaks, making the ability to anticipate and actively respond critical for survival and success. Traditional stable approaches become obsolete; rapid adaptation and innovative transformation become essential.
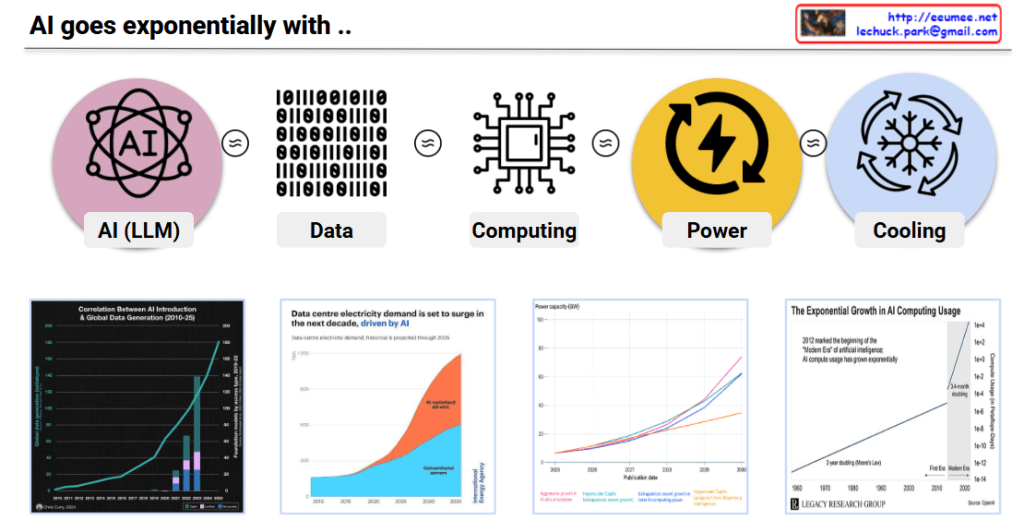
This infographic illustrates how AI’s exponential growth triggers a cascading exponential expansion across all interconnected domains.
Core Concept: Exponential Chain Reaction
Top Process Chain: AI’s exponential growth creates proportionally exponential demands at each stage:
AI (LLM) ≈ Data ≈ Computing ≈ Power ≈ Cooling
The “≈” symbol indicates that each element grows exponentially in proportion to the others. When AI doubles, the required data, computing, power, and cooling all scale proportionally.
Evidence of Exponential Growth Across Domains
1. AI Networking & Global Data Generation (Top Left)
Exponential increase beginning in the 2010s
Vertical surge post-2020
2. Data Center Electricity Demand (Center Left)
Sharp increase projected between 2026-2030
Orange (AI workloads) overwhelms blue (traditional workloads)
AI is the primary driver of total power demand growth
3. Power Production Capacity (Center Right)
2005-2030 trends across various energy sources
Power generation must scale alongside AI demand
4. AI Computing Usage (Right)
Most dramatic exponential growth
Modern AI era begins in 2012
Doubling every 6 months (extremely rapid exponential growth)
Over 300,000x increase since 2012
Three exponential growth phases shown (1e+0, 1e+2, 1e+4, 1e+6)
Key Message
This infographic demonstrates that AI development is not an isolated phenomenon but triggers exponential evolution across the entire ecosystem:
As AI models advance → Data requirements grow exponentially
As data increases → Computing power needs scale exponentially
As computing expands → Power consumption rises exponentially
As power consumption grows → Cooling systems must expand exponentially
All elements are tightly interconnected, creating a ‘cascading exponential effect’ where exponential growth in one domain simultaneously triggers exponential development and demand across all other domains.
Resolution is Speed: Data Resolution Strategy in Rapidly Changing Environments
Core Concept
When facing rapid changes and challenges, increasing data resolution is the key strategy to maximize problem-solving speed. While low-resolution data may suffice in stable, low-change situations, high-resolution data becomes essential in complex, volatile environments.
Processing Framework
High Resolution Sensing: Fine-grained detection of changing environments
Computing Foundation: Securing basic computing capabilities to quantify high-resolution data
Big Data Processing: Rapid processing of large-scale, high-resolution data
AI Amplification: Maximizing big data processing capabilities through AI assistance
Resulting Benefits
Through this high-resolution data processing approach:
Fast Reaction Available: Enables rapid response to changes
More Stable and Efficient: Achieves real stability and efficiency
Attains predictable and controllable states even in highly volatile environments
Real-world Application and Necessity
These changes and challenges are occurring continuously, and AI Data Centers (AI DCs) must become the physical embodiment of rapid change response through high-resolution data processing—this is an urgent imperative. The construction and operation of AI DCs is not an option but a survival necessity, representing essential infrastructure that must be established to maintain competitiveness in the rapidly evolving digital landscape.
This diagram illustrates the “Computing Evolutions” from the perspective of data’s core attributes development.
Top: Core Data Properties
Data: Foundation of digital information composed of 0s and 1s
Store: Data storage technology
Transfer: Data movement and network technology
Computing: Data processing and computational technology
AI Era: The convergence of all these technologies into the artificial intelligence age
Bottom: Evolution Stages Centered on Each Property
Storage-Centric Era: Data Center
Focus on large-scale data storage and management
Establishment of centralized server infrastructure
Transfer-Centric Era: Internet
Dramatic advancement in network technology
Completion of global data transmission infrastructure
“Data Ready”: The point when vast amounts of data became available and accessible
Computing-Centric Era: Cloud Computing
Democratization and scalability of computing power
Development of GPU-based parallel processing (blockchain also contributed)
“Infra Ready”: The point when large-scale computing infrastructure was prepared
Convergence to AI Era With data prepared through the Internet and computing infrastructure ready through the cloud, all these elements converged to enable the current AI era. This evolutionary process demonstrates how each technological foundation systematically contributed to the emergence of artificial intelligence.
BitNet is an innovative neural network architecture that achieves extreme efficiency through ultra-low precision quantization while maintaining model performance through strategic design choices.
Key Features
1. Ultra-Low Precision (1.58-bit)
Uses only 3 values: {-1, 0, +1} for weights
Entropy calculation: log₂(3) ≈ 1.58 bits
More efficient than standard 2-bit (4 values) representation
2. Weight Quantization
Ternary weight system with correlation-based interpretation:
+1: Positive correlation
-1: Negative correlation
0: No relation
3. Multi-Layer Structure
Leverages combinatorial power of multi-layer architecture
Enables non-linear function approximation despite extreme quantization
4. Precision-Targeted Operations
Minimizes high-precision operations
Combines 8-bit activation (input data) with 1.58-bit weights
Precise activation functions where needed
5. Hardware & Kernel Optimization
CPU (ARM) kernel-level optimization
Leverages bitwise operations (especially multiply → bit operations)
Memory management through SIMD instructions
Supports non-standard nature of 1.58-bit data
6. Token Relationship Computing
Single token uses N weights of {1, -1, 0} to calculate relationships with all other tokens
Summary
BitNet represents a breakthrough in neural network efficiency by using extreme weight quantization (1.58-bit) that dramatically reduces memory usage and computational complexity while preserving model performance through hardware-optimized bitwise operations and multi-layer combinatorial representation power.
This diagram illustrates the evolution of mainstream data types throughout computing history, showing how the complexity and volume of processed data has grown exponentially across different eras.
Database (1960s-1970s) – Structured Data: Tabular, organized data became central
Internet (1980s-1990s) – Text/Hypertext: Web pages, emails, and text-based information
Video (2000s-2010s) – Multimedia Data: Explosive growth of video, images, and audio content
Machine Learning (2010s-Present) – Big Data/Pattern Data: Large-scale, multi-dimensional datasets for training
Human Perceptible/Everything (Future) – Universal Cognitive Data: Digitization of all human senses, cognition, and experiences
The question marks on the right symbolize the fundamental uncertainty surrounding this final stage. Whether everything humans perceive – emotions, consciousness, intuition, creativity – can truly be fully converted into computational data remains an open question due to technical limitations, ethical concerns, and the inherent nature of human cognition.
Summary: This represents a data-centric view of computing evolution, progressing from simple numerical processing to potentially encompassing all aspects of human perception and experience, though the ultimate realization of this vision remains uncertain.