Operational Excellence

From DALL-E with some prompting
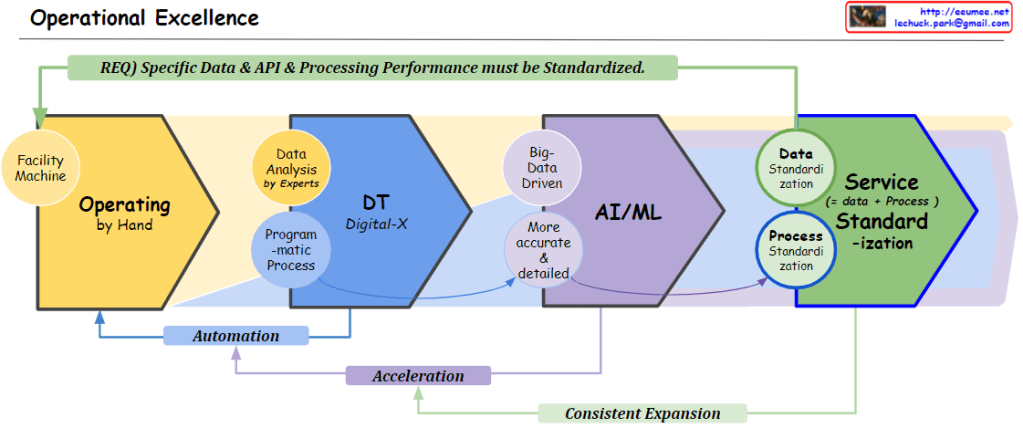
The image delineates a progressive digital transformation process aimed at achieving operational efficiency. It comprises four main stages, each incorporating specific elements and influencing improvements in the preceding stages:

  1. Manual Operation (Operating by Hand): This foundational stage involves the hands-on operation of facilities or machinery, focusing on the physical manipulation of equipment.
  2. Digital Transformation (DT): Data derived from manual operations are analyzed by experts and digitized through programmatic processes. This stage fosters automation, enhancing the efficiency and optimization of processes.
  3. AI/ML: The data processed through digital transformation are further analyzed with AI and machine learning technologies, driven by large-scale data to achieve more accurate and detailed insights. These analyses facilitate the acceleration and consistent expansion of processes and services.
  4. Service Standardization: The final stage involves standardizing data and processes based on the insights from AI/ML analysis. Essential for delivering high-quality services, it necessitates a clear definition of necessary data, its integration, and performance parameters from facilities and machinery.

Each of these stages is interdependent, with the arrows at the bottom indicating a feedback loop to the previous stages. For instance, insights from AI/ML promote data standardization, which, in turn, contributes to the improvement of digital transformation and manual operations. This creates a cyclical mechanism where each phase reinforces the others, allowing for continuous enhancement of the overall system.

Unchanging data

from DALL-E with some prompting
The image illustrates a process of monitoring typically unchanging data to detect system malfunctions. The ‘Traffic / User(s)’ data reflects the relative amount of traffic between two connected users, which generally remains constant. The heat generated by the CPU, as well as electrical elements like voltage and current, are also considered unchanging data in a stable state. A fault detection sensor sends an alert when anomalies are detected in these data points. The ‘Detect it!!’ sensor shows no changes under normal conditions but identifies deviations when an event occurs, enabling a response to potential issues.

maintain 1

From DALL-E with some prompting
The image contrasts the concept of maintaining the number “1” in the digital world versus the real world.

  • In the Digital World: The “1” represented in binary code is said to be very easy to maintain in the digital realm, implying that as long as there is electricity, the data “1” can be precisely preserved.
  • In the Real World: It questions the existence of a perfect “1,” showing values like 0.99999 and 1.00001 around the numerical representation of “1,” suggesting that maintaining an absolute “1” in the real world is challenging.
  • The phrases “Everything is Changed” and “Everything is Connected” at the bottom emphasize that in the real world, everything is subject to change and interconnected.

Overall, the image presents a philosophical inquiry into how the concept of “1” can be applied and interpreted differently between the digital and real worlds. While the digital world can uphold the accuracy and consistency of data, the real world embeds complexities and nuances within the concept of constancy.

Never miss an alert

From DALL-E with some prompting
The image illustrates the interaction between an alert system and a data analysis system, comprised of two distinct stages:

Raw Level Hardware (HW) Alert Detection:
This stage emphasizes internal alarms, which are hardwired to ensure that alerts are raised in critical situations without any buffering, allowing for the fastest possible alarm detection. The message “Don’t forget This Step is required” underscores the indispensability of this stage.

Analyzed Software (SW) Alert Detection:
Data passes through storage devices to analysis tools, where it can be subject to delays or potential loss. The data is analyzed by code, enabling advanced analysis with AI. However, the phrase “Even though You have a wonderful Data Analysis System” reiterates the importance of raw-level alert detection, regardless of the sophistication of the data analysis system.

Overall, the image indicates that raw-level alerts are crucial for immediate response needs, and while advanced data analysis can enhance system alerting and monitoring, it cannot replace the need for immediate alert mechanisms. The title “Never miss an alert” emphasizes the critical nature of these alert systems.

Optimization

from DALL-E with some prompting
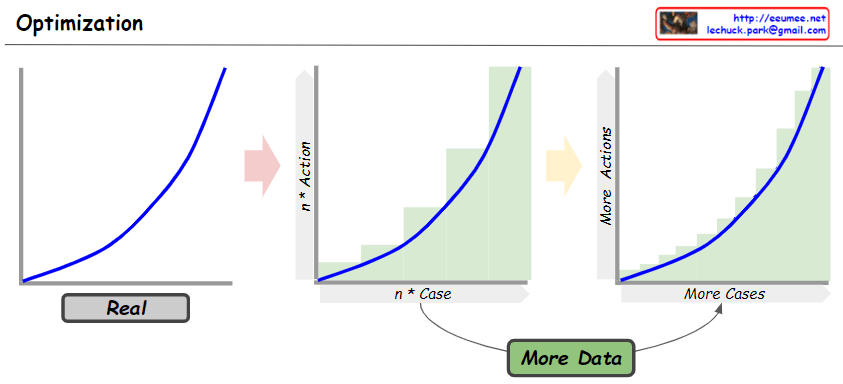
This diagram demonstrates that the optimization process becomes more sophisticated with the increase of data. The first graph represents the actual analog conditions, and as more data is introduced, the bar chart in the middle shows that actions can be more finely differentiated for various cases. The last graph illustrates how this refinement enhances the optimization curve. In essence, optimization can be more precisely adjusted based on a diverse range of data and scenarios.

All data is connected

from DALL-E with some prompting
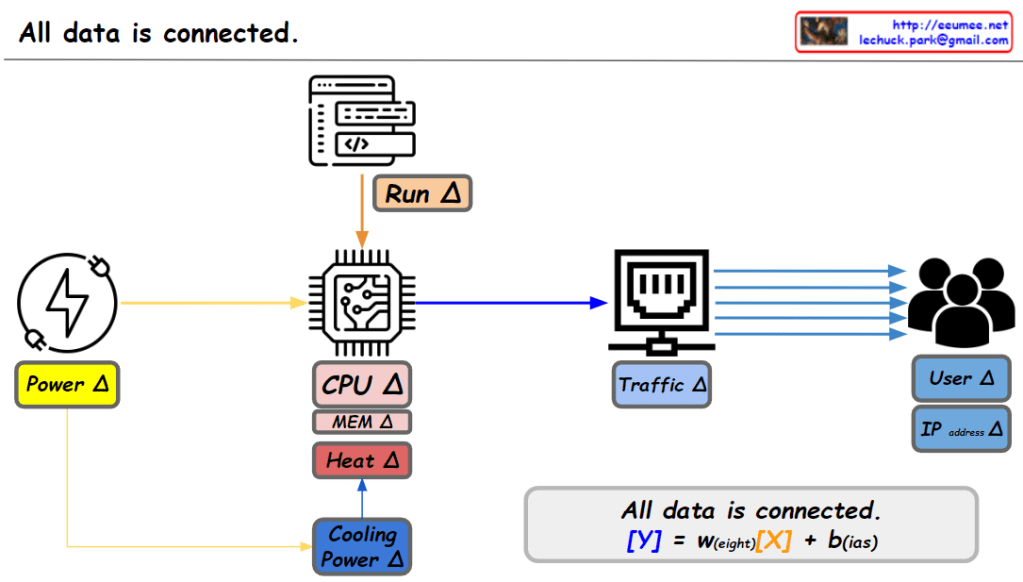
This image illustrates that key metrics generated from computing activities (such as power, CPU performance, memory usage, heat, and cooling power), data traffic, and user behavior (e.g., IP addresses) are interconnected. These metrics influence one another and their interactions can provide insights into the overall state of the system. The linear regression equation at the bottom of the image represents a simple mathematical model for analyzing and predicting the relationships between these metrics, suggesting how they can be numerically understood and connected.