
Sunny
The Computing for the Fair Human Life.

From Claude with some prompting
This image compares raster (pixel) and vector graphics. On the left, there are two pixel-based images showing simple shapes. In the middle, there is a grid representing pixel data, with 0s and 1s likely indicating whether each pixel is on or off.
On the right side, there is a vector graphic representation of a line, which is defined by attributes like length, direction angle, and starting location coordinates. Vector graphics can be resized and zoomed smoothly without losing quality, as illustrated by the zoomed-in vector line on the far right.
The key difference highlighted is that raster images are composed of individual pixels, while vector graphics are based on mathematical equations defining shapes and lines, allowing for smooth scaling and rendering at any resolution. This comparison helps understand the fundamental differences between these two common digital graphic formats and their respective strengths.

From Claude with some prompting
This image illustrates the flow and process of a Time Series Database (TSDB) system. The main components are:
Time Series Data: This is the input data stream containing time-stamped values from various sources or metrics.
Counting: It performs change detection on the incoming time series data to capture relevant events or anomalies.
Delta Value: The difference or change observed in the current value compared to a previous reference point, denoted as NOW() – previous value.
Time-series summary Value: Various summary statistics like MAX, MIN, and other aggregations are computed over the time window.
Threshold Checking: The delta values and other aggregations are evaluated against predefined thresholds for anomaly detection.
Alert: If any threshold conditions are violated, an alert is triggered to notify the monitoring system or personnel.
The process also considers correlations with other metrics for improved anomaly detection context. Additionally, AI-based techniques can derive new metrics from the existing data for enhanced monitoring capabilities.
In summary, this flow diagram represents the core functionality of a time series database focused on capturing, analyzing, and alerting on anomalies or deviations from expected patterns in real-time data streams.

From Claude with some prompting
This diagram depicts an architecture for data center (DC) infrastructure expansion and integrated operations management across multiple sites. The key features include:
This architecture enables unified management of distributed infrastructure resources in an expanded DC environment and enhances operational efficiency through data-driven optimization.
By consolidating monitoring and integrating data analytics, organizations can gain comprehensive insights, make informed decisions, and streamline operations across their distributed data center footprint.
From Claude with some prompting
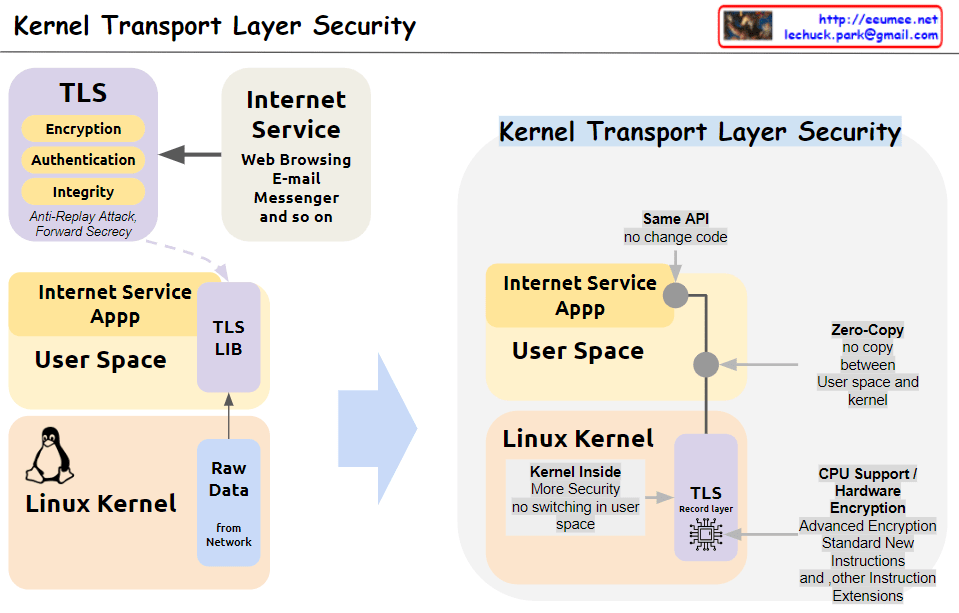
This image illustrates the concept and structure of KTLS (Kernel Transport Layer Security). KTLS implements the TLS protocol within the Linux kernel to improve performance and security.
In summary, by moving TLS processing to the kernel level, KTLS significantly improves both performance and security simultaneously.
From Claude with some prompting
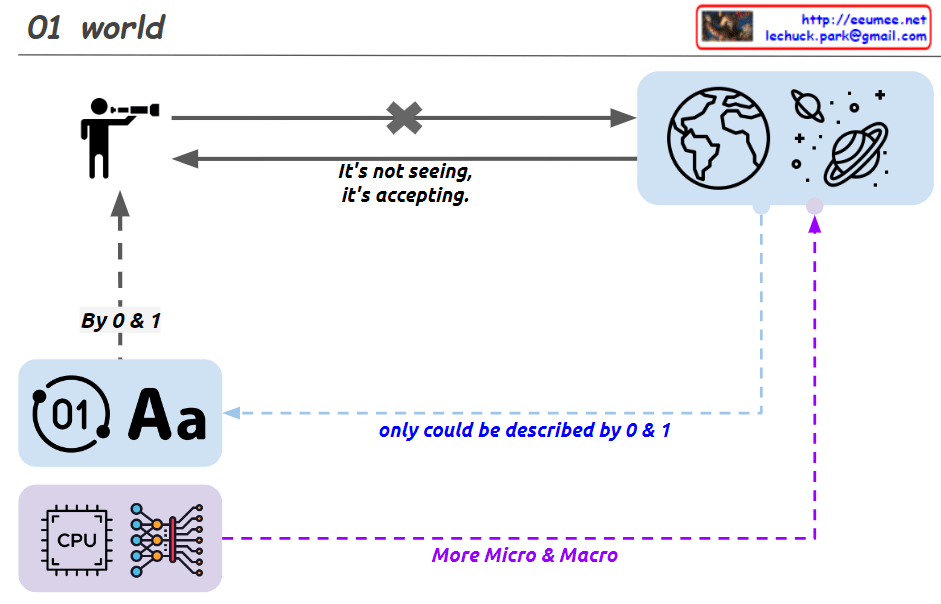
This image depicts the evolution of how humans perceive and express the world around them.
It starts with the binary system of 0 and 1, from which letters and numbers were created, leading to the creation of the digital world represented by “01 Aa”.
Humans take in data from the world through various channels such as sight, sound, and touch in a comprehensive manner. This received data is then distinguished and perceived as 0 and 1, A and B, and so on.
With the advancement of computing technology and AI, tools like CPUs and neural networks enabled a deeper understanding of the world from both microscopic and macroscopic perspectives.
The images of the Earth and the universe symbolize the entirety of the world that humans perceive.
Therefore, this image illustrates the evolution of human perception, starting from the binary system, progressing through the comprehensive intake of data from various channels, and culminating in the development of computing and AI technologies.

From ChatGPT with some prompting
Overview of TCP BBR:
n * MSS) and the pacing rate (the rate at which data is sent).In summary, TCP BBR learns the network conditions by monitoring the bottleneck bandwidth and RTT, and accordingly adjusts the sending size and pacing rate to optimize data transmission, reducing congestion and improving performance.
