AI Infrastructure Architect & Technical Visualizer "Complex Systems, Simplified. I translate massive AI infrastructure into visual intelligence." I love to learn computer tech and help people by the digital.
Humans are affected by numerous external factors such as food, sleep, family, and work, causing distractions and fatigue, whereas AI operates solely based on its predefined purpose, continuously performing the same task as long as it has power.
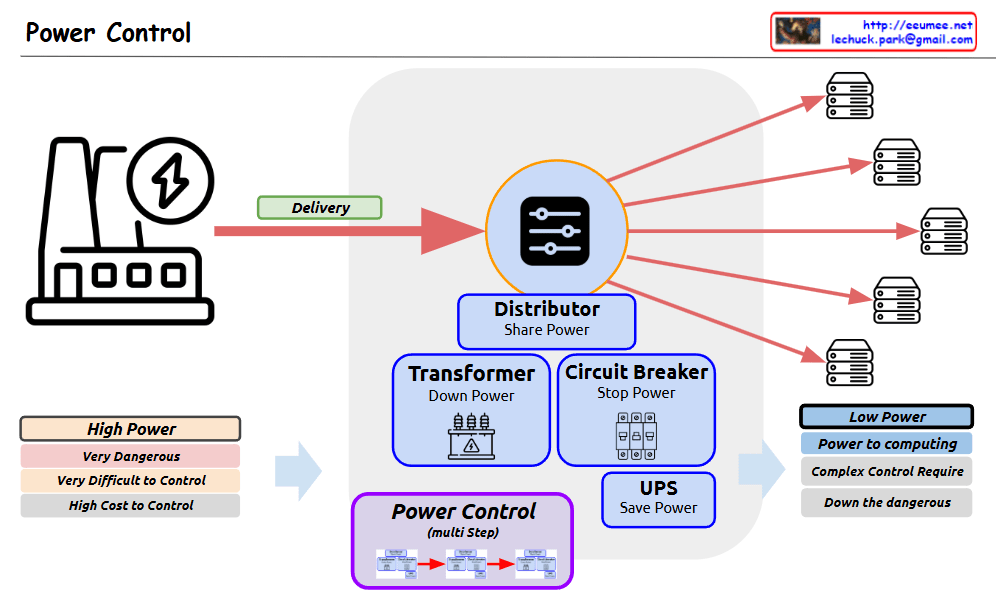
The diagram shows the complete process of how high-power electricity is safely and efficiently controlled and converted into low-power suitable for computing systems. The power flow is illustrated through a “Delivery” phase, passing through various protective and control devices before being distributed to multiple servers or computing equipment.
The system emphasizes safety and control through multiple stages:
Initial high-power input is marked as dangerous and difficult to control
Multiple control mechanisms (transformer, circuit breaker, UPS) manage the power
The distributor splits the controlled power to multiple endpoints
Final output is appropriate for computing equipment
This setup ensures safe and reliable power distribution while reducing the risks associated with high-power electrical systems.
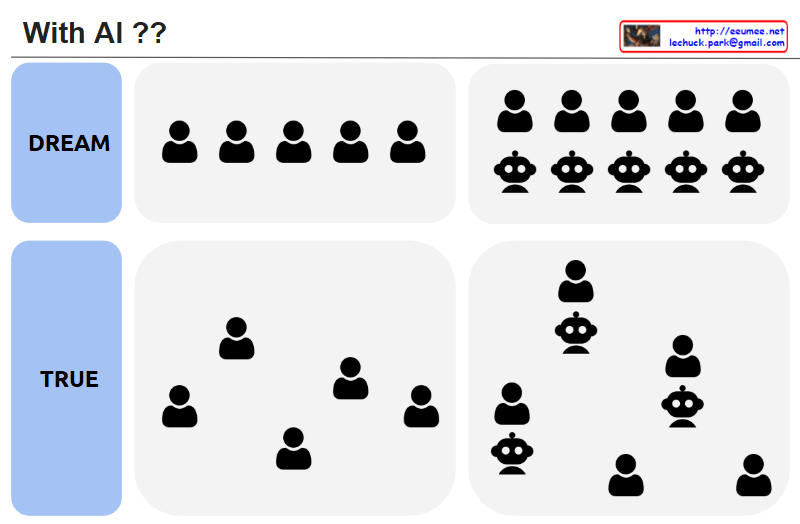
The image is divided into “DREAM” (ideal) and “TRUE” (reality), contrasting human society and AI integration scenarios.
2. Human Society Representation
Ideal (DREAM)
All human icons positioned at the same height
Symbolizes perfect social equality
Presents a utopian vision without hierarchical or power differences
Reality (TRUE)
Human icons placed irregularly at different heights
Reflects the inevitable existence of social hierarchy and power structures
Suggests that perfect equality is difficult to achieve in reality
3. AI and Human Relationship
Ideal (DREAM)
AI icons aligned uniformly below human icons
Represents AI under complete human control
Expresses the expectation that humans can perfectly control AI as a tool
Reality (TRUE)
AI and human icons randomly placed at various heights
Some AI icons positioned higher than humans
Indicates that AI may surpass human capabilities or authority in certain domains
4. Key Messages
Perfect equality in human society remains an ideal, while reality always contains some form of hierarchy.
The expectation of complete control over AI may be unrealistic, as AI can potentially exceed human capabilities in specific areas.
It’s important to acknowledge and understand the gap between ideals and reality.
5. Overall Implications
The image effectively visualizes the disconnect between our expectations and reality in both human social structures and AI integration. It suggests that while we may dream of perfect equality and control, the reality is more complex and unpredictable, requiring us to adapt our understanding and expectations accordingly.
The system architecture is divided into main sections:
Traffic flow through IN PORT and OUT PORT
Routing based on Destination IP address
Inside TCP/IP and over TCP/IP sections
Security-Related Conditions
Analysis
AI/ML-Based Traffic Analysis
Detailed features:
Inside TCP/IP: TCP/UDP Flags, IP TOS (Type of Service), VLAN Tags, MPLS Labels
Over TCP/IP: HTTP/HTTPS Headers, DNS Queries, TLS/SSL Information, API Endpoints
Security-Related: Malicious Traffic Patterns, Encryption Status
Analysis: Time-Based Conditions, Traffic Patterns, Network State Information
The AI/ML-Based Traffic Analysis section shows:
AI/ML technologies learn traffic patterns
Detection of anomalies
Traffic control based on specific conditions
This diagram represents a comprehensive approach to modern network monitoring and control, integrating traditional networking technologies with advanced AI/ML capabilities. The system shows a complete flow from packet ingress to analysis, incorporating various layers of inspection and control mechanisms. with Claude
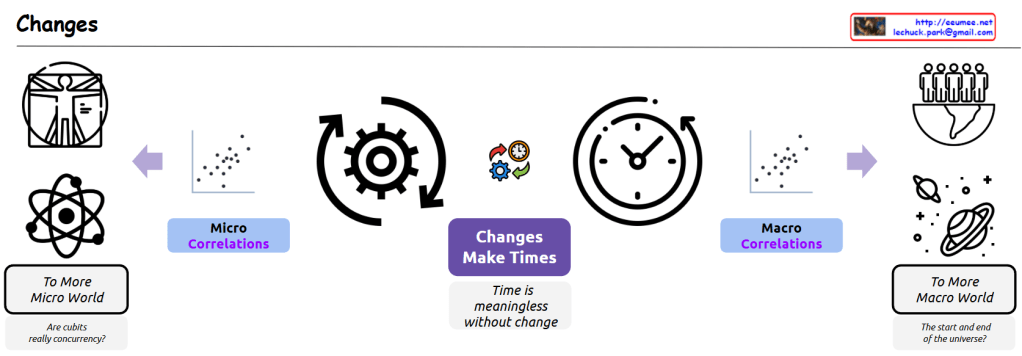
This image is a conceptual diagram titled “Changes” that explores the relationship between time and change. Let me break down its key components:
In the center:
There’s a large gear icon and clock symbol with the text “Changes Make Times”
Below it states “Time is meaningless without change”
On the left side:
Icons showing the Vitruvian Man and an atomic structure
Labeled “Micro Correlations”
Text reading “To More Micro World”
Poses the question “Are qubits really concurrency?”
On the right side:
Icons depicting humanity on Earth and celestial objects
Labeled “Macro Correlations”
Text reading “To More Macro World”
Poses the question “The start and end of the universe?”
Throughout the diagram, there are scatter plot graphs and arrows suggesting connections between these different scales.
This diagram appears to be exploring a philosophical and scientific concept about how change and time are interconnected across all scales – from the quantum level (micro) to the cosmic scale (macro). The central thesis seems to be that change is fundamental to our understanding and experience of time, as suggested by the statement that time is meaningless without change.
The diagram suggests a continuous spectrum of investigation from quantum mechanics (represented by qubits) all the way to cosmology (represented by questions about the universe’s beginning and end), with change being the common thread that connects these different scales of existence.