Connected in AI DC

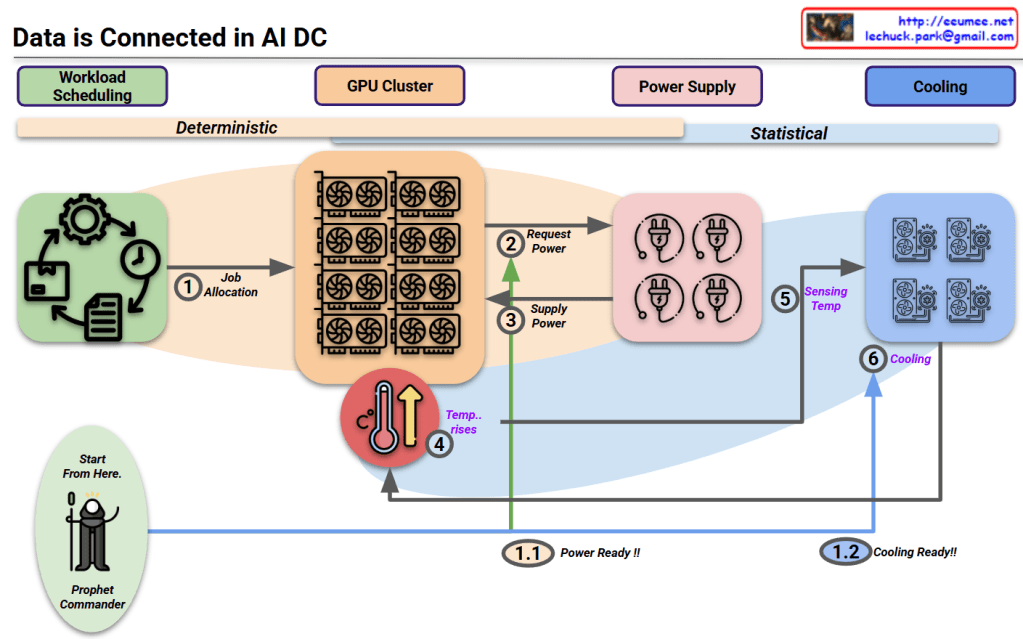
This diagram titled “Data is Connected in AI DC” illustrates the relationships starting from workload scheduling in an AI data center.

Key aspects of the diagram:

  1. The entire system’s interconnected relationships begin with workload scheduling.
  2. The diagram divides the process into two major phases:
    • Deterministic phase: Primarily concerned with power requirements that operate in a predictable, planned manner.
    • Statistical phase: Focused on cooling requirements, where predictions vary based on external environmental conditions.
  3. The “Prophet Commander” at the workload scheduling stage can predict/direct future requirements, allowing the system to prepare power (1.1 Power Ready!!) and cooling (1.2 Cooling Ready!!) in advance.
  4. Process flow:
    • Job allocation from workload scheduling to GPU cluster
    • GPUs request and receive power
    • Temperature rises due to operations
    • Cooling system detects temperature and activates cooling

This diagram illustrates the interconnected workflow in AI data centers, beginning with workload scheduling that enables predictive resource management. The process flows from deterministic power requirements to statistical cooling needs, with the “Prophet Commander” enabling proactive preparation of power and cooling resources. This integrated approach demonstrates how workload prediction can drive efficient resource allocation throughout the entire AI data center ecosystem.

With Claude

Data Center

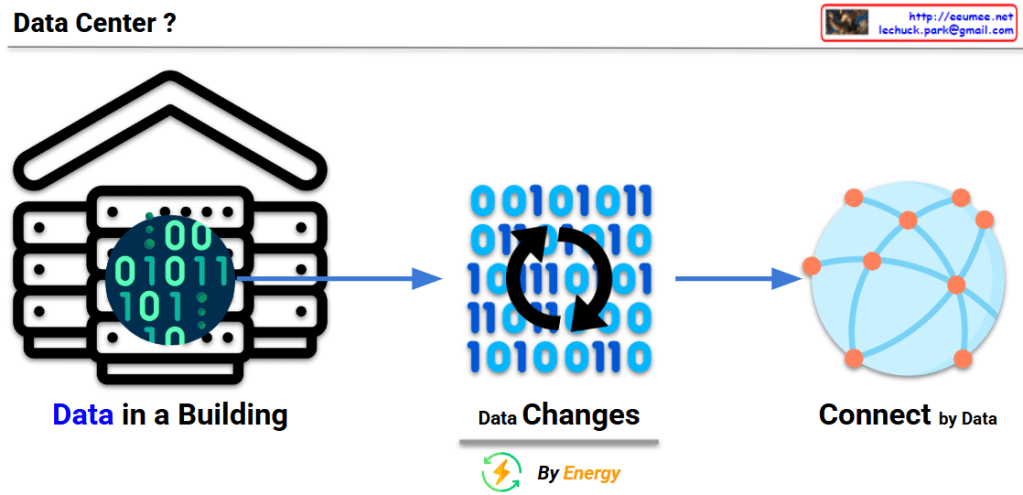
This image explains the fundamental concept and function of a data center:

  1. Left: “Data in a Building” – Illustrates a data center as a physical building that houses digital data (represented by binary code of 0s and 1s).
  2. Center: “Data Changes” – With the caption “By Energy,” showing how data is processed and transformed through the consumption of energy.
  3. Right: “Connect by Data” – Demonstrates how processed data from the data center connects to the outside world, particularly the internet, forming networks.

This diagram visualizes the essential definition of a data center – a physical building that stores data, consumes energy to process that data, and plays a crucial role in connecting this data to the external world through the internet.

With Claude

TCP Challenge ACK

This image explains the TCP Challenge ACK mechanism.

At the top, it shows a normal “TCP Connection Established” state. Below that, it illustrates two attack scenarios and the defense mechanism:

  1. First scenario: An attacker sends a SYN packet with SEQ(attack) value to an already connected session. The server responds with a TCP Challenge ACK.
  2. Second scenario: An attacker sends an RST packet with SEQ(attack) value. The server checks if the SEQ(attack) value is within the receive window size (RECV_WIN_SIZE):
    • If the value is inside the window (YES) – The session is reset.
    • If the value is outside the window (NO) – A TCP Challenge ACK is sent.

Additional information at the bottom includes:

  • The Challenge ACK is generated in the format seed ACK = SEQ(attack)+@
  • The net.ipv4.tcp_challenge_ack_limit setting indicates the limit number of TCP Challenge ACKs sent per second, which is used to block RST DDoS attacks.

Necessity and Effectiveness of TCP Challenge ACK:

TCP Challenge ACK is a critical mechanism for enhancing network security. Its necessity and effectiveness include:

  • Preventing Connection Hijacking: Detects and blocks attempts by attackers trying to hijack legitimate TCP connections.
  • Session Protection: Protects existing TCP sessions from RST/SYN packets with invalid sequence numbers.
  • Attack Validation: Verifies the authenticity of packets through Challenge ACKs, preventing connection termination by malicious packets.
  • DDoS Mitigation: Protects systems from RST flood attacks that maliciously terminate TCP connections.
  • Defense Against Blind Attacks: Increases the difficulty of blind attacks by requiring attackers to correctly guess the exact sequence numbers for successful attacks.

With Claude

Personal with AI

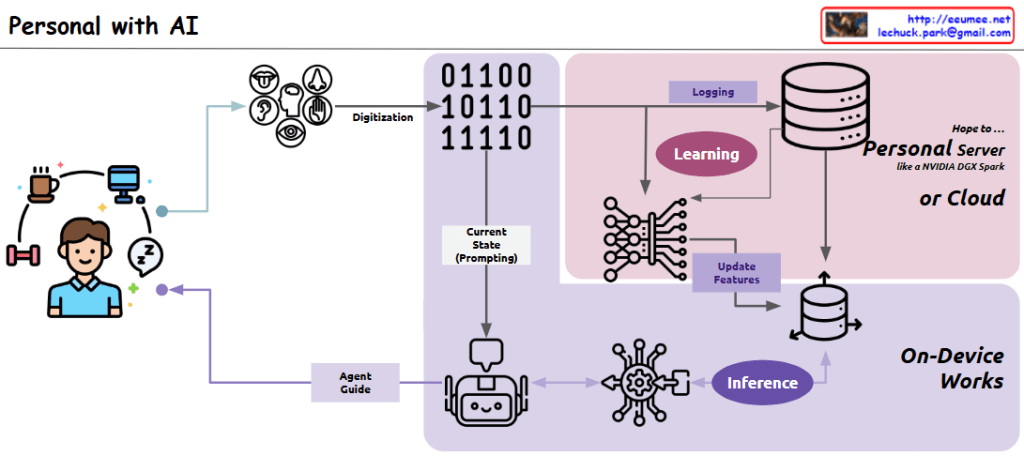
This diagram illustrates a “Personal Agent” system architecture that shows how everyday life is digitized to create an AI-based personal assistant:

Left side: The user’s daily activities (coffee, computer, exercise, sleep) are represented, which serve as the source for digitization.

Center-left: Various sensors (visual, auditory, tactile, olfactory, gustatory) capture the user’s daily activities and convert them through the “Digitization” process.

Center: The “Current State (Prompting)” component stores the digitized current state data, which is provided as prompting information to the AI agent.

Upper right (pink area): Two key processes take place:

  1. “Learning”: Processing user data from an ML/LLM perspective
  2. “Logging”: Continuously collecting data to update the vector database

This section runs on a “Personal Server or Cloud,” preferably using a personalized GPU server like NVIDIA DGX Spark, or alternatively in a cloud environment.

Lower right: In the “On-Device Works” area, the “Inference” process occurs. Based on current state data, the AI agent infers guidance needed for the user, and this process is handled directly on the user’s personal device.

Center bottom: The cute robot icon represents the AI agent, which provides personalized guidance to the user through the “Agent Guide” component.

Overall, this system has a cyclical structure that digitizes the user’s daily life, learns from that data to continuously update a personalized vector database, and uses the current state as a basis for the AI agent to provide customized guidance through an inference process that runs on-device.

with Claude

Data Explosion in Data Center

This image titled “Data Explosion in Data Center” illustrates three key challenges faced by modern data centers:

  1. Data/Computing:
    • Shows the explosive growth of data from computing servers to internet/cloud infrastructure and AI technologies.
    • Visualizes the exponential increase in data volume from 1X to 100X, 10,000X, and ultimately to 1,000,000,000X (one billion times).
    • Depicts how servers, computers, mobile devices, and global networks connect to massive data nodes, generating and processing enormous amounts of information.
  2. Power:
    • Addresses the increasing power supply requirements needed to support the data explosion in data centers.
    • Shows various energy sources including traditional power plants, wind turbines, solar panels, and battery storage systems to meet the growing energy demands.
    • Represents energy efficiency and sustainable power supply through a cyclical system indicated by green arrows.
  3. Cooling:
    • Illustrates the heat management challenges resulting from increased data processing and their solutions.
    • Explains the shift from traditional air cooling methods to more efficient server liquid cooling technologies.
    • Visualizes modern cooling solutions with blue circular arrows representing the cooling cycle.

This diagram comprehensively explains how the exponential growth of data impacts data center design and operations, particularly highlighting the challenges and innovations in power consumption and thermal management.

With Claude