TCS (Technology Cooling Loop)

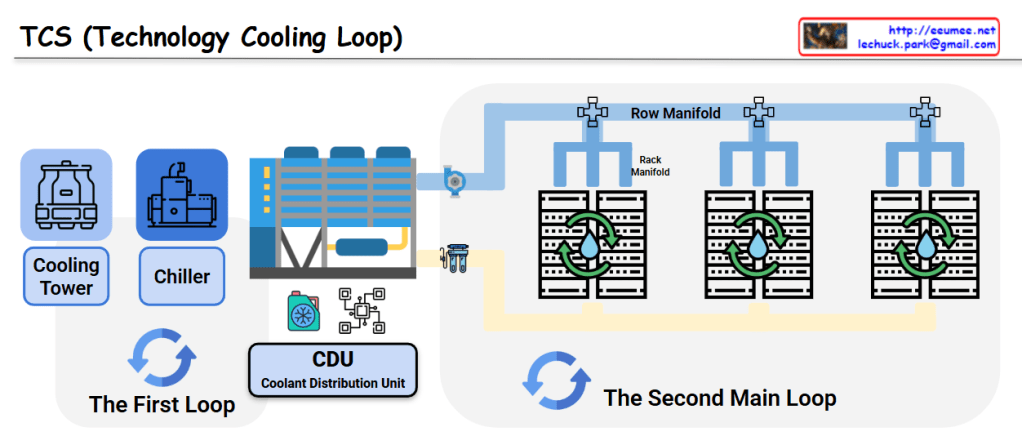
This image shows a diagram of the TCS (Technology Cooling Loop) system structure.

System Components

The First Loop:

  • Cooling Tower: Dissipates heat to the atmosphere
  • Chiller: Generates chilled water
  • CDU (Coolant Distribution Unit): Distributes coolant throughout the system

The Second Main Loop:

  • Row Manifold: Distributes cooling water to each server rack row
  • Rack Manifold: Individual rack-level cooling water distribution system
  • Server Racks: IT equipment racks that require cooling

System Operation

  1. Primary Loop: The cooling tower releases heat to the outside air, while the chiller produces chilled water that is supplied to the CDU
  2. Secondary Loop: Coolant distributed from the CDU flows through the Row Manifold to each server rack’s Rack Manifold, cooling the servers
  3. Circulation System: The heated coolant returns to the CDU where it is re-cooled through the primary loop

This is an efficient cooling system used in data centers and large-scale IT facilities. It systematically removes heat generated by server equipment to ensure stable operations through a two-loop architecture that separates the heat rejection process from the precision cooling delivery to IT equipment.

With Claude

1210th day

Eeumee.net: Your Daily Dose of Tech Clarity!

Tired of complex tech concepts feeling like a tangled mess? At Eeumee.net, we simplify the intricate world of technology into easy-to-digest, one-page diagrams, delivered daily!

What makes eeumee.net unique?

  • Visual Learning, Daily: We create a new, concise diagram (like a PPT page) every single day, breaking down essential technical elements into clear, visual summaries.
  • AI-Powered Precision: Each diagram is then interpreted and refined using advanced Large Language Models (LLMs). This process ensures that the definitions and explanations are accurate, well-structured, and easy to understand.
  • Master Your Concepts: Our primary goal is to help you (and us!) easily organize and solidify important technical knowledge in your mind. We believe that a clear definition is crucial for effective communication and accurate understanding in any technical discussion.
  • Enhance Technical Discussions: By providing precise and visually intuitive definitions, Eeumee.net serves as a vital resource for ensuring everyone is on the same page during technical conversations. It’s about fostering shared understanding and clarity.

Why visit eeumee.net?

Whether you’re a seasoned professional looking to quickly refresh a concept, a student trying to grasp new ideas, or simply someone who appreciates clear and concise explanations, Eeumee.net is your go-to resource. Stop struggling with vague definitions and start building a solid foundation of technical understanding, one diagram at a time.

Visit us today and bring clarity to your technical world!

Imaged by ChatGPT, Promotion text by Gemini

HIRING AN AI AGENT

In the future, organizations might hire AI agents instead of people, shifting focus from salaries to model usage fees, performance, and data quality. Choosing the right AI could require strong problem definition and benchmarking, along with infrastructure like data centers and computing power.

with ChatGPT

Data Center Digitalization

This image presents a roadmap for “Data Center Digitalization” showing the evolutionary process. Based on your explanation, here’s a more accurate interpretation:

Top 4 Core Concepts (Purpose for All Stages)

  • Check Point: Current state inspection and verification point for each stage
  • Respond to change: Rapid response system to quick changes
  • Target Image: Final target state to be achieved
  • Direction: Overall strategic direction setting

Digital Transformation Evolution Stages

Stage 1: Experience-Based Digital Environment Foundation

  • Easy to Use: Creating user-friendly digital environments through experience
  • Integrate Experience: Integrating existing data center operational experience and know-how into the digital environment
  • Purpose: Utilizing existing operational experience as checkpoints to establish a foundation for responding to changes

Stage 2: DevOps Integrated Environment Configuration

  • DevOps: Development-operations integrated environment supporting Fast Upgrade
  • Building efficient development-operations integrated systems based on existing operational experience and know-how
  • Purpose: Implementing DevOps environment that can rapidly respond to changes based on integrated experience

Stage 3: Evolution to Intelligent Digital Environment

  • Digital Twin & AI Agent(LLM): Accumulated operational experience and know-how evolve into digital twins and AI agents
  • Intelligent automated decision-making through Operation Evolutions
  • Purpose: Establishing intelligent systems toward the target image and confirming operational direction

Stage 4: Complete Automation Environment Achievement

  • Robotics: Unmanned operations through physical automation
  • Digital 99.99% Automation: Nearly complete digital automation environment integrating all experience and know-how
  • Purpose: Achieving the final target image – complete digital environment where all experience is implemented as automation

Final Goal: Simultaneous Development of Stability and Efficiency

WIN-WIN Achievement:

  • Stable: Ensuring high availability and reliability based on accumulated operational experience
  • Efficient: Maximizing operational efficiency utilizing integrated know-how

This diagram presents a strategic roadmap where data centers systematically integrate existing operational experience and know-how into digital environments, evolving step by step while reflecting the top 4 core concepts as purposes for each stage, ultimately achieving both stability and efficiency simultaneously.

With Claude

By Charts

This image visually explains various ways charts help in decision-making.

Here’s a breakdown of the key elements:

Left Side:

  • An icon representing a chart is shown. This signifies the role of charts in visually representing data.

Center:

Five main roles of charts in contributing to decision-making are listed:

  1. Detecting Short-Term Anomalies (Problem Identification): Charts help in identifying short-term unusual patterns and pinpointing problems.
  2. Analyzing Long-Term Trends (Future Planning & Identifying Savings Opportunities): Charts are used to understand long-term data tendencies, which aids in future planning and discovering cost-saving opportunities.
  3. Comparing Against Baselines (Performance Measurement & Benchmarking): Charts are utilized to measure current performance against predefined baselines and for benchmarking purposes.
  4. Identifying Savings Opportunities: Through chart analysis, areas or methods for cost reduction can be identified.
  5. Communicating Insights Effectively (Stakeholder Reporting & Decision Making): Charts are valuable for visualizing complex data in an easy-to-understand manner, assisting in stakeholder reporting and supporting decision-making.

Right Side:

  • An icon depicting people connected by arrows is visible, with the text “Help for Decisions.” This indicates that all the roles of charts mentioned above ultimately aim to facilitate effective decision-making.

In summary, this image emphasizes that charts go beyond simple data visualization; they are essential tools for identifying problems, understanding trends, measuring performance, discovering opportunities, and ultimately leading to clear decision-making through data analysis.

With Gemini

MLC, ELC from ASHRAE 90.4

This image illustrates the concepts of PUE (Power Usage Effectiveness), MLC (Mechanical Load Component), and ELC (Electrical Loss Component) as defined in ASHRAE 90.4 standard.

Key Component Analysis:

1. PUE (Power Usage Effectiveness)

  • A metric measuring data center power usage efficiency
  • Formula: PUE = (P_IT + P_mech + P_elec_loss) / P_IT
  • Total power consumption divided by IT equipment power

2. MLC (Mechanical Load Component)

  • Ratio of mechanical load component to IT power
  • Formula: MLC = P_mech / P_IT
  • Represents how much power the cooling systems (chiller, pump, cooling tower, CRAC, etc.) consume relative to IT power

3. ELC (Electrical Loss Component)

  • Ratio of electrical loss component to IT power
  • Formula: ELC = P_elec_loss / P_IT
  • Represents how much power is lost in electrical infrastructure (PDU, UPS, transformer, switchgear, etc.) relative to IT power

Diagram Structure:

Each component is connected as follows:

  • Left: Component definition
  • Center: Equipment icons (cooling systems, power systems, etc.)
  • Right: IT equipment (server racks)

Necessity and Management Benefits:

These metrics are essential for optimizing power costs that constitute a significant portion of data center operating expenses, enabling identification of inefficient cooling and power system segments to reduce power costs and determine investment priorities.

This represents the ASHRAE standard methodology for systematically analyzing data center power efficiency and creating economic and environmental value through continuous improvement.

With Claude

Human data

This updated image titled “Data?” presents a deeper philosophical perspective on data and AI.

Core Concept:

Human Perception is Limited

  • Compared to the infinite complexity of the real world, the scope that humans can perceive and define is constrained
  • The gray area labeled “Human perception is limited” visualizes this boundary of recognition

Two Dimensions of AI Application:

  1. Deterministic Data
    • Data domains that humans have already defined and structured
    • Contains clear rules and patterns that AI can process in predictable ways
    • Represents traditional AI problem-solving approaches
  2. Non-deterministic Data
    • Data from domains that humans haven’t fully defined
    • Raw data from the real world with high uncertainty and complexity
    • Areas where AI must discover and utilize patterns without prior human definitions

Key Insight: This diagram illustrates that AI’s true potential extends beyond simply solving pre-defined human problems. While AI can serve as a tool that opens new possibilities by transcending human cognitive boundaries and discovering complex patterns from the real world that we haven’t yet defined or understood, there remains a crucial human element in this process. Even as AI ventures into unexplored territories of reality beyond human-defined problem spaces, humans still play an essential role in determining how to interpret, validate, and responsibly apply these AI-discovered insights. The diagram suggests a collaborative relationship where AI expands our perceptual capabilities, but human judgment and decision-making remain fundamental in guiding how these expanded possibilities are understood and utilized.

With Claude