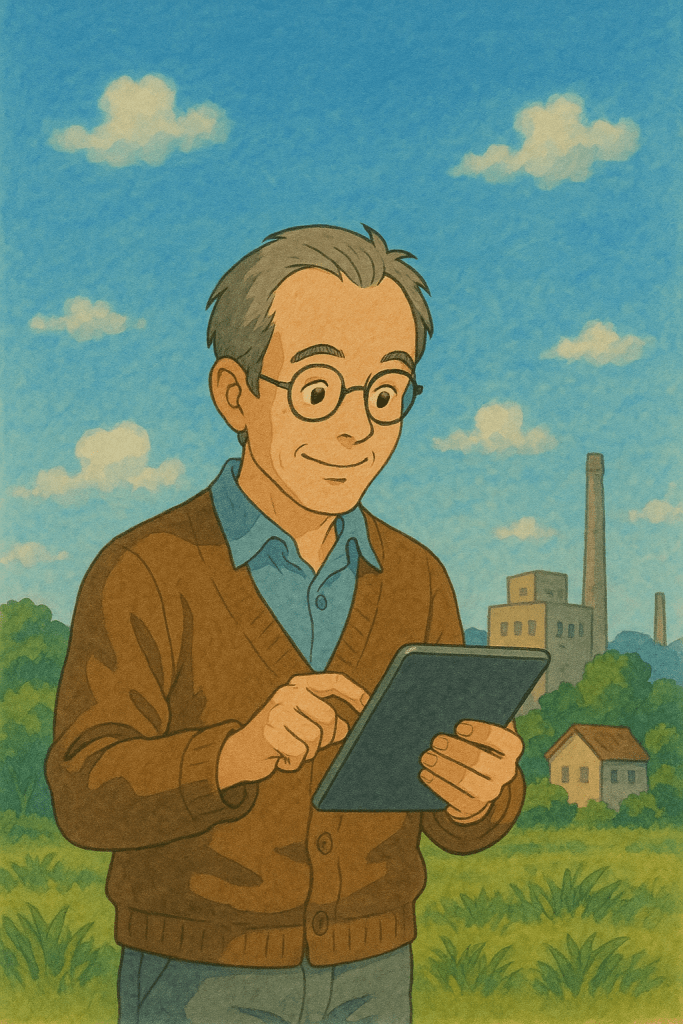
Outing
The Computing for the Fair Human Life.

This infographic titled “Together” emphasizes the critical importance of parallel processing = working together across all domains – computing, AI, and human society.
Core Concept:
The Common Thread Across All 5 Domains – ‘Parallel Processing’:
Essential Elements of Parallel Processing:
Reinterpreted Message: “togetherness is always difficult, but it’s something we have to do.”
This isn’t merely about the challenges of cooperation. Rather, it conveys that parallel processing (working together) in all systems requires high energy costs, but only through optimization via synchronization and sharing can we achieve true efficiency and performance.
Whether in computing systems, AI, or human society – all complex systems cannot advance without parallel cooperation among individual components. This is an unavoidable and essential process for any sophisticated system to function and evolve. The insight reveals a fundamental truth: the energy investment in “togetherness” is not just worthwhile, but absolutely necessary for progress.
With Claude
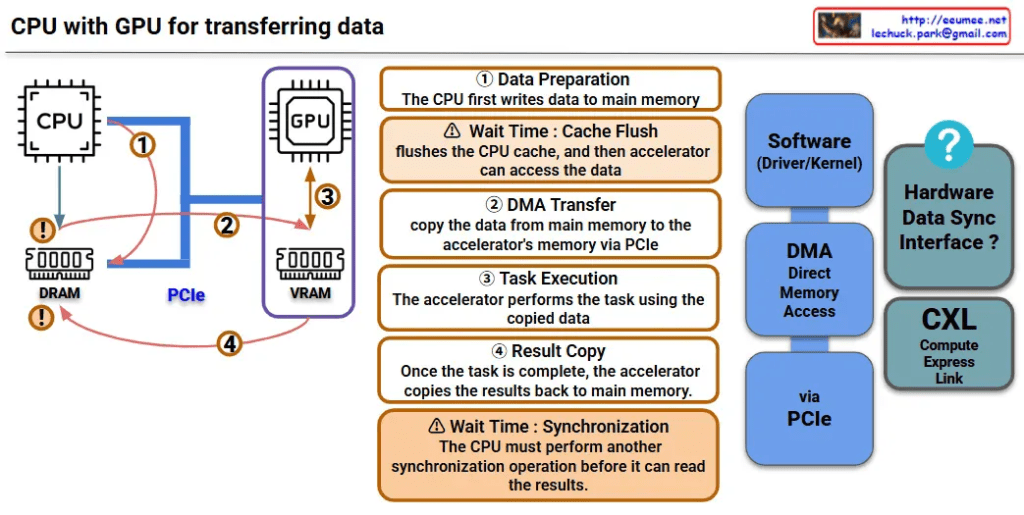
This image is a diagram explaining the data transfer process between CPU and GPU. Let me interpret the main components and processes.
Hardware:
Software/Interfaces:
Step 1 – Data Preparation
Step 2 – DMA Transfer
Step 3 – Task Execution
Step 4 – Result Copy
This diagram shows the major bottlenecks in CPU-GPU data transfer:
CXL (Compute Express Link) shown on the right side of the diagram represents next-generation technology for improving this data transfer process, offering an alternative approach to solve the complex 4-step process and related performance bottlenecks.
This diagram demonstrates how CPU-GPU data transfer involves a complex 4-step process with performance bottlenecks caused by memory copying overhead, synchronization wait times, and PCIe bandwidth limitations. CXL is presented as a next-generation technology solution that can overcome the limitations of traditional data transfer methods.
With Claude

This image is a conceptual diagram titled “Human Extend” that illustrates the cognitive extension of human capabilities and the role of AI tools.
“Human See” at the center represents the core of human observation and understanding abilities.
Left: Macro Perspective
Right: Micro Perspective
The upper portion shows two supporting tools:
This diagram visually represents the concept that human cognitive abilities can be extended through AI tools and data analysis, enabling deeper mutual understanding between microscopic details and macroscopic patterns. It illustrates the complementary relationship where understanding small details leads to better prediction of the big picture, and understanding the big picture leads to more accurate prediction of details.
The diagram suggests that AI and data serve as amplifying tools that enhance human perception, allowing for more sophisticated analysis across different scales of observation and prediction.
with Claude

This diagram illustrates the architecture of an LLM Operations (LLMOps) system, demonstrating how Large Language Models are deployed and operated in industrial settings.
1. Data Input Sources (3 Categories)
2. Central Processing System
3. LLM Operations
4. Final Output and Control
This system represents a smart factory solution that integrates AI into traditional industrial operations, providing comprehensive management from real-time data monitoring to operational manual utilization.
The key principle is that while AI provides comprehensive analysis and recommendations, the final operational decisions and approvals still rest with human operators. This is clearly represented through the operator icon and approval/rejection buttons at the bottom of the diagram.
This demonstrates a realistic and desirable AI operational model that emphasizes safety, accountability, and the importance of human judgment in unpredictable situations.
With Claude

This diagram illustrates the 3 Core Technological Components of AI World and their surrounding challenges.
Data management as the raw material for AI technology:
Performance enhancement of AI technology:
Ensuring reliability and trustworthiness of AI technology:
This diagram demonstrates how the three core technological elements – AI Infrastructure, AI Model, and AI Agent – form the center of AI World, while interacting with the three fundamental challenges of Data, Optimization, and Verification to create a comprehensive AI ecosystem.
With Claude