Server Room Flow

With Claude
Comprehensive Analysis of Server Room HVAC System Configuration and Operation

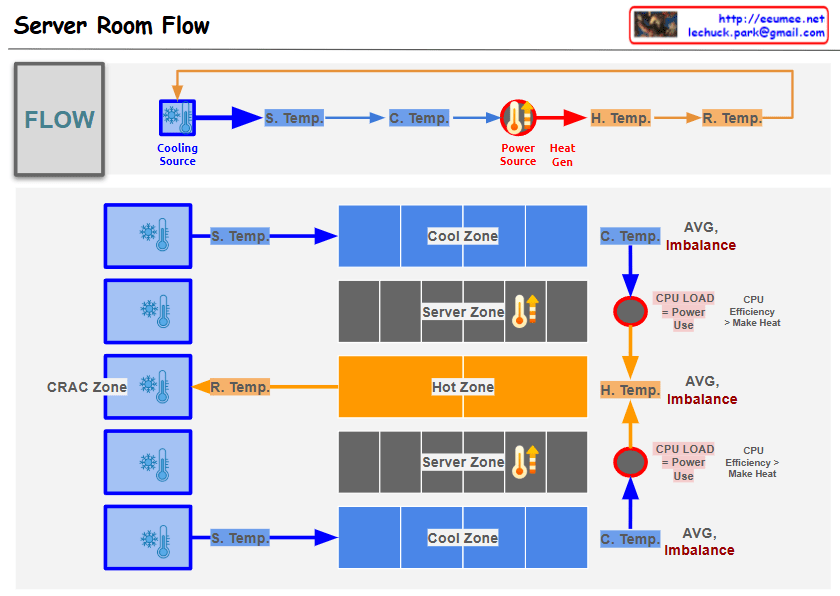
  1. Physical Configuration
  • Multiple cooling units arranged in CRAC (Computer Room Air Conditioning) Zone
  • Three-tier structure: Cool Zone, Server Zone, Hot Zone
  • Upper and lower distribution structure for air circulation
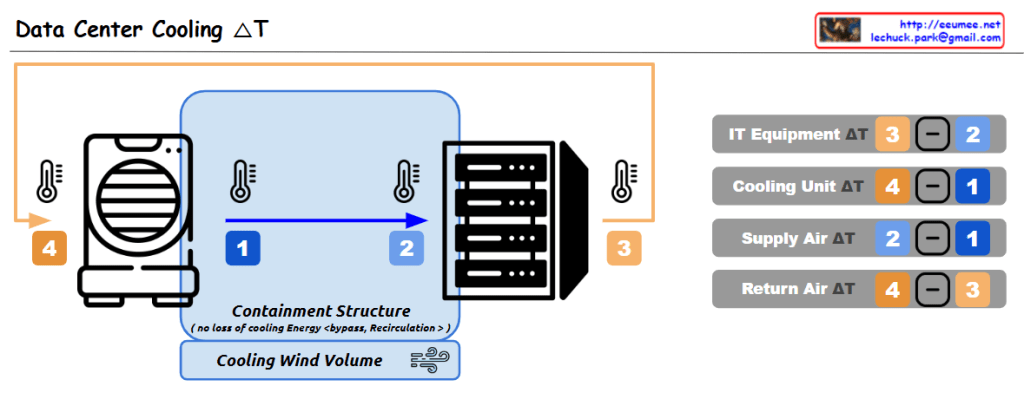
  1. Temperature Monitoring System
  • Supply Temperature (S. Temp): Cooling unit output temperature
  • Cooling Zone Temperature (C. Temp): Pre-server intake temperature
  • Hot Zone Temperature (H. Temp): Server exhaust temperature
  • Return Temperature (R. Temp): CRAC intake temperature
  1. Efficiency Management Indicators
  • AVG. Imbalance monitoring for each section
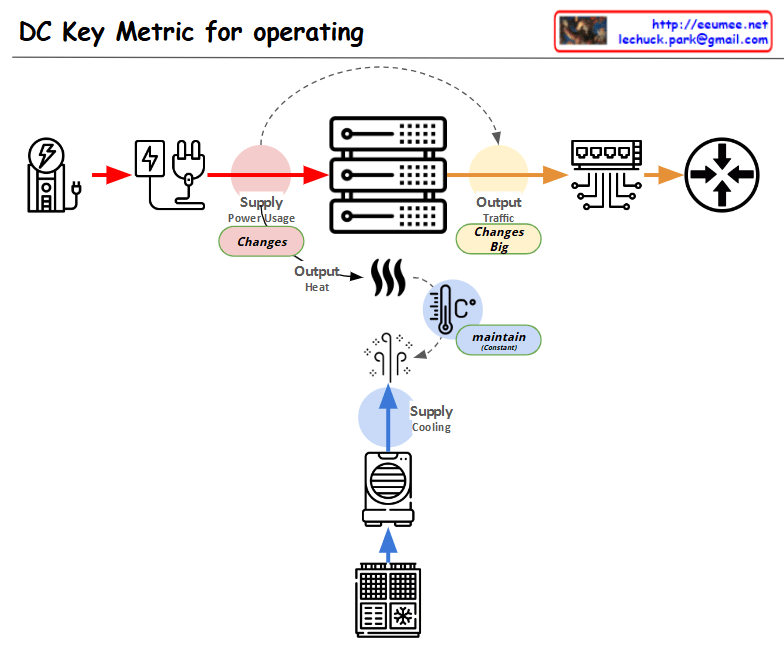
  • CPU load and power consumption correlation analysis
  • CPU efficiency and heat generation relationship tracking
  1. Analysis Points
  • Delta T analysis between sections
  • Temperature variation patterns by time/season
  • Power efficiency and cooling efficiency correlation
  • System stability prediction indicators
  1. Operational Goals
  • Operating cost optimization
  • Provide stable server operating environment
  • Energy-efficient cooling system operation
  • Proactive problem detection and response

DC Cooling (delta)T

From Claude with some prompting
This data center cooling system utilizes a containment structure to control the airflow around the IT equipment, which helps improve cooling efficiency. The cooled air is supplied to the equipment, and the warmer exhaust air is expelled outside.

The key aspect of this system is the monitoring of temperature differences (ΔT) between the various components, which enables the following analyses and improvements:

  1. IT Equipment ΔT (3 – 2): This represents the temperature rise across the IT equipment itself, indicating the amount of heat generated by the IT hardware. Analyzing this can help identify opportunities to improve the efficiency of the IT equipment, such as through layout optimization or hardware upgrades.
  2. Cooling Unit ΔT (4 – 1): This is the temperature difference across the cooling unit, where the air is cooled. A smaller ΔT indicates higher efficiency of the cooling unit. Monitoring this metric allows for continuous evaluation and optimization of the cooling unit’s performance.
  3. Supply Air ΔT (2 – 1): This is the temperature change of the cooled air as it is supplied into the data center. A smaller ΔT here suggests the cooled air is being effectively distributed.
  4. Return Air ΔT (4 – 3): This is the temperature rise of the air as it is returned from the data center. A larger ΔT indicates the cooling system is effectively removing more heat from the data center.

These temperature difference data points are crucial baseline information for evaluating and improving the overall efficiency of the data center cooling system. By continuously monitoring and analyzing these metrics, the facility can optimize energy usage, cooling costs, and system reliability.

DC Key metrics for operating

From Claude with some prompting
This diagram showing the key metrics for Data Center (DC) operations:

  1. Power Supply Chain:
  • Power input → Power conversion/distribution → Server equipment
  • Marked as “Supply Power Usage” with a note indicating “Changes” in variability
  1. Server Operations:
  • Server racks shown in the center
  • Two main outputs:
    • Top: “Output Traffic” with a note “Changes Big” indicating high variability
    • Bottom: “Output Heat” generation
  1. Cooling System:
  • Cooling equipment shown at the bottom
  • Marked as “Supply Cooling”
  • Temperature icon with “maintain” indicator showing the need to maintain consistent temperature
  1. Overall Flow:
  • Power input → Server operations → Network output
  • Separate cooling circulation system for heat management

The diagram illustrates the interconnection between three critical elements of data center operations:

  • Power supply management
  • Server operations
  • Cooling system

Each component shows potential variability points (marked as “Changes”) and management requirements, with special attention to:

  • Power usage monitoring
  • Traffic output management
  • Heat dissipation and temperature control

This visualization effectively demonstrates how these systems work together in a data center environment, highlighting the key areas that require monitoring and management for optimal operation.

What to do first

From Claude with some prompting
This image outlines a progressive approach to data monitoring and alert systems, starting with simple metrics and evolving to more complex AI-driven solutions. The key steps are:

  1. “Keeping a Temperature”: Basic monitoring of system temperatures.
  2. “Monitoring”: Continuous observation of temperature data.
  3. “Alerts with thresholds”: Simple threshold-based alerts.
  4. More complex metrics: Including 10-minute thresholds, change counts, averages, and derivations.
  5. “More Indicators”: Expanding to additional KPIs and metrics.
  6. “Machine Learning ARIMA/LSTM”: Implementing advanced predictive models.
  7. “Alerts with predictions”: AI-driven predictive alerts.

The central message “EASY FIRST BEFORE THE AI !!” emphasizes starting with simpler methods before advancing to AI solutions.

Importantly, the image also implies that these simpler metrics and indicators established early on will later serve as valuable training data for AI models. This is shown by the arrows connecting all stages to the machine learning component, suggesting that the data collected throughout the process contributes to the AI’s learning and predictive capabilities.

This approach not only allows for a gradual build-up of system complexity but also ensures that when AI is implemented, it has a rich dataset to learn from, enhancing its effectiveness and accuracy.

Unchanging data

from DALL-E with some prompting
The image illustrates a process of monitoring typically unchanging data to detect system malfunctions. The ‘Traffic / User(s)’ data reflects the relative amount of traffic between two connected users, which generally remains constant. The heat generated by the CPU, as well as electrical elements like voltage and current, are also considered unchanging data in a stable state. A fault detection sensor sends an alert when anomalies are detected in these data points. The ‘Detect it!!’ sensor shows no changes under normal conditions but identifies deviations when an event occurs, enabling a response to potential issues.