SRE for AI Factory

Comprehensive Image Analysis: SRE for AI Factory

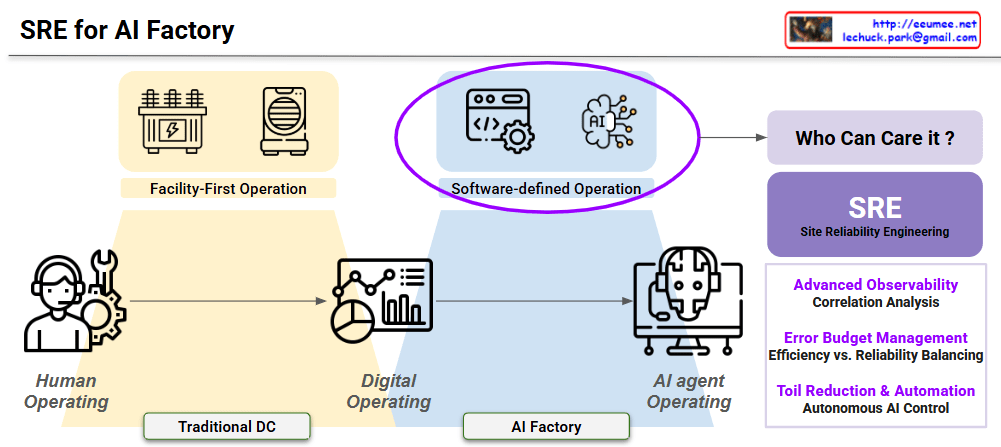
1. Operational Evolution (Bottom Flow)

  • Human Operating (Traditional DC): Depicts the legacy stage where manual intervention and physical inspections are the primary means of management.
  • Digital Operating: A transitional phase represented by dashboards and data visualization, moving toward data-informed decision-making.
  • AI Agent Operating (AI Factory): The future state where autonomous AI agents (like your AIDA platform) manage complex infrastructures with minimal human oversight.

2. Shift in Core Methodology (Top Transition)

  • Facility-First Operation: Focuses on the physical health of hardware (Transformers, Cooling units) to ensure basic uptime.
  • Software-Defined Operation (Highlighted): The centerpiece of the transition. It treats infrastructure as code, using software logic and AI to control physical assets dynamically.

3. The Solution: SRE (Site Reliability Engineering)

The image identifies SRE as the definitive answer to the question “Who can care for it?” by applying three technical pillars:

  • Advanced Observability: Moving beyond binary alerts to deep Correlation Analysis of power and cooling data.
  • Error Budget Management: Quantitatively Balancing Efficiency (PUE) vs. Reliability to push performance without risking failure.
  • Toil Reduction & Automation: Achieving scalability through Autonomous AI Control, eliminating repetitive manual tasks.

3-Line Summary

  • Paradigm Shift: Evolution from hardware-centric “Facility-First” management to code-driven “Software-Defined Operation.”
  • The Role of SRE: Implementation of SRE principles is the essential bridge to managing the high complexity of AI Factories.
  • Operational Pillars: Success relies on Advanced Observability, Error Budgeting (PUE optimization), and Toil Reduction via AI automation.

#AIFactory #SRE #SoftwareDefinedOperation #AIOps #DataCenterAutomation #Observability #InfrastructureAsCode

with Gemini

Predictive Count/Resolve Time for .


the “Predictive Count/Resolve Time” Diagram

This diagram illustrates the workflow of IT Operations or System Maintenance, specifically comparing Predictive Maintenance (Proactive) versus Recovery/Reactive (Reactive) processes.

It is divided into two main flows: the Preventive Flow (Left) and the Reactive Flow (Right).

1. Left Flow: Predictive Maintenance

This represents the ideal process where anomalies are detected and addressed before a full system failure occurs.

  • Process:
    • Work Changes / Monitoring: Routine operations and continuous system monitoring.
    • Anomaly: The system exhibits abnormal patterns, but it hasn’t failed yet.
    • Detection (Awareness): Monitoring tools or operators detect this anomaly.
    • Predictive Maintenance: Maintenance is performed proactively to prevent the fault.
  • Key Performance Indicators (KPIs):
    • Count: The number of times predictive maintenance was performed.
    • PTM Success Rate: A metric to measure success (e.g., considered successful if no disability/failure occurs within 14 days after the predictive maintenance).

2. Right Flow: Reactive Recovery

This is the response process when an anomaly is missed, leading to an actual system failure.

  • Process:
    • Abnormal → Alert: The condition worsens, triggering an alert. The time taken to reach this point is MTTD (Mean Time To Detect).
    • Fault Down: The system actually fails or goes down.
    • Propagation Time (to Experts): The time it takes to escalate the issue to the right experts. This relates to MTTE (Mean Time To Engage Expert).
    • Recovery Time: The time taken by experts to fix the issue.
  • Key Performance Indicators (KPIs):
    • MTTR (Mean Time To Resolve/Repair): The total time from the failure (Fault Down) until the system is fully recovered. Reducing this time is a critical operational goal.

3. Summary & Key Takeaway

The diagram visually emphasizes the importance of “preventing issues before they happen (Left)” rather than “fixing them after they break (Right).”

  • Flow Logic: If an ‘Anomaly’ is successfully ‘Detected’, it leads to ‘Predictive Maintenance’. If missed, it escalates to ‘Abnormal’ and results in a ‘Fault Down’.
  • Goal: The objective is to minimize MTTR (downtime) on the right side and increase the PTM Count (proactive prevention) on the left side to ensure high system availability.

#DevOps #SRE #PredictiveMaintenance #MTTR #IncidentManagement #ITOperations #SystemMonitoring #DisasterRecovery #MTTD #TechMaintenance

With Gemini