Temperate Prediction in DC

Overall Structure

Top: CFD (Computational Fluid Dynamics) based approach Bottom: ML (Machine Learning) based approach

CFD Approach (Top)

  • Basic Setup:
    • Spatial Definition & Material Properties: Physical space definition of the data center and material characteristics (servers, walls, air, etc.)
    • Boundary Conditions: Setting boundary conditions (inlet/outlet temperatures, airflow rates, heat sources, etc.)
  • Processing:
    • Configuration + Physical Rules: Application of physical laws (heat transfer equations, fluid dynamics equations, etc.)
    • Heat Flow: Heat flow calculations based on defined conditions
  • Output: Heat + Air Flow Simulation (physics-based heat and airflow simulation)

ML Approach (Bottom)

  • Data Collection:
    • Real-time monitoring through Metrics/Data Sensing
    • Operational data: Power (Kw), CPU (%), Workload, etc.
    • Actual temperature measurements through Temperature Sensing
  • Processing: Pattern learning through Machine Learning algorithms
  • Output: Heat (with Location) Prediction (location-specific heat prediction)

Key Differences

CFD Method: Theoretical calculation through physical laws using physical space definitions, material properties, and boundary conditions as inputs ML Method: Data-driven approach that learns from actual operational data and sensor information for prediction

The key distinction is that CFD performs simulation from predefined physical conditions, while ML learns from actual operational data collected during runtime to make predictions.

With Claude

Server Room Workload

This diagram illustrates a server room thermal management system workflow.

System Architecture

Server Internal Components:

  • AI Workload, GPU Workload, and Power Workload are connected to the CPU, generating heat

Temperature Monitoring Points:

  • Supply Temp: Cold air supplied from the cooling system
  • CoolZone Temp: Temperature in the cooling zone
  • Inlet Temp: Server inlet temperature
  • Outlet Temp: Server outlet temperature
  • Hot Zone Temp: Temperature in the heat exhaust zone
  • Return Temp : Hot air return to the cooling system

Cooling System:

  • The Cooling Workload on the left manages overall cooling
  • Closed-loop cooling system that circulates back via Return Temp

Temperature Delta Monitoring

The bottom flowchart shows how each workload affects temperature changes (ΔT):

  • Delta temperature sensors (Δ1, Δ2, Δ3) measure temperature differences across each section
  • This data enables analysis of each workload’s thermal impact and optimization of cooling efficiency

This system appears to be a data center thermal management solution designed to effectively handle high heat loads from AI and GPU-intensive workloads. The comprehensive temperature monitoring allows for precise control and optimization of the cooling infrastructure based on real-time workload demands.

With Claude

Data in AI DC

This image illustrates a data monitoring system for an AI data center server room. Titled “Data in AI DC Server Room,” it depicts the relationships between key elements being monitored in the data center.

The system consists of four main components, each with detailed metrics:

  1. GPU Workload – Right center
    • Computing Load: GPU utilization rate (%) and type of computational tasks (training vs. inference)
    • Power Consumption: Real-time power consumption of each GPU (W) – Example: NVIDIA H100 GPU consumes up to 700W
    • Workload Pattern: Periodicity of workload (peak/off-peak times) and predictability
    • Memory Usage: GPU memory usage patterns (e.g., HBM3 memory bandwidth usage)
  2. Power Infrastructure – Left
    • Power Usage: Real-time power output and efficiency of UPS, PDU, and transformers
    • Power Quality: Voltage, frequency stability, and power loss rate
    • Power Capacity: Types and proportions of supplied energy, ensuring sufficient power availability for current workload operations
  3. Cooling System – Right
    • Cooling Device Status: Air-cooling fan speed (RPM), liquid cooling pump flow rate (LPM), and coolant temperature (°C)
    • Environmental Conditions: Data center internal temperature, humidity, air pressure, and hot/cold zone temperatures – critical for server operations
    • Cooling Efficiency: Power Usage Effectiveness (PUE) and proportion of power consumed by the cooling system
  4. Server/Rack – Top center
    • Rack Power Density: Power consumption per rack (kW) – Example: GPU server racks range from 30 to 120 kW
    • Temperature Profile: Temperature (°C) of GPUs, CPUs, memory modules, and heat distribution
    • Server Status: Operational state of servers (active/standby) and workload distribution status

The workflow sequence indicated at the bottom of the diagram represents:

  1. ① GPU WORK: Initial execution of AI workloads – GPU computational tasks begin, generating system load
  2. ② with POWER USE: Increased power supply for GPU operations – Power demand increases with GPU workload, and power infrastructure responds accordingly
  3. ③ COOLING WORK: Cooling processes activated in response to heat generation
    • Sensing: Temperature sensors detect server and rack thermal conditions, monitoring hot/cold zone temperature differentials
    • Analysis: Analysis of collected temperature data, determining cooling requirements
    • Action: Adjustment of cooling equipment (fan speed, coolant flow rate, etc. automatically regulated)
  4. ④ SERVER OK: Maintenance of normal server operation through proper power supply and cooling – Temperature and power remain stable, allowing GPU workloads to continue running under optimal conditions

The arrows indicate data flow and interrelationships between systems, showing connections from power infrastructure to servers and from cooling systems to servers. This integrated system enables efficient and stable data center operation by detecting increased power demand and heat generation from GPU workloads, and adjusting cooling systems in real-time accordingly.

With Claude

Server Room Cooling Metrics

This dashboard is designed to monitor the comprehensive performance of server room cooling systems by displaying temperature changes alongside server power consumption data, while also tracking water flow rate (Water LPM) and fan speed. The main utilities and applications of this approach include:

  1. Integrated Data Visualization:
    • Enables simultaneous monitoring of temperature, power consumption, and cooling system parameters (flow rate, fan speed) in a single dashboard, facilitating the identification of correlations between systems.
    • Allows operators to immediately observe how increases in power consumption lead to temperature rises and the subsequent response of cooling systems.
  2. Benefits of Heat Map Implementation:
    • Represents data from multiple temperature sensors categorized as MAX/MIN/AVG with color differentiation, providing intuitive understanding of spatial temperature distribution.
    • Creates clear visual contrast between yellow (HOTZONE) and blue (COOLZONE) areas, making temperature gradients easily recognizable.
    • Enables quick identification of temperature anomalies for early detection of potential issues.
  3. Cooling Efficiency Monitoring:
    • Facilitates analysis of the relationship between Water LPM (water flow rate) and temperature changes to evaluate cooling water usage efficiency.
    • Allows assessment of air circulation system effectiveness by examining correlations between fan speed and COOLZONE/HOTZONE temperature changes.
    • Enables real-time monitoring of heat exchange efficiency through the difference between RETURN TEMP and SUPPLY TEMP.
  4. Event Detection and Analysis:
    • Features an “EVENT(Big Change?)” indicator that helps quickly identify significant changes or anomalies.
    • Displays data from the past 30 minutes in 5-minute intervals, enabling analysis of short-term trends and patterns.
  5. Operational Decision Support:
    • Provides immediate feedback on the effects of cooling system adjustments (changes in flow rate or fan speed) on temperature, enabling optimization of operational parameters.
    • Helps evaluate the response capability of cooling systems during increased server loads, supporting capacity planning.
    • Offers necessary data to balance energy efficiency with server stability.

This dashboard goes beyond a simple monitoring tool to serve as a comprehensive decision support system for optimizing thermal management in server rooms, improving energy efficiency, and ensuring equipment stability. The heat map visualization approach, in particular, makes complex temperature data intuitively interpretable, allowing operators to quickly assess situations and respond appropriately.

With Claude

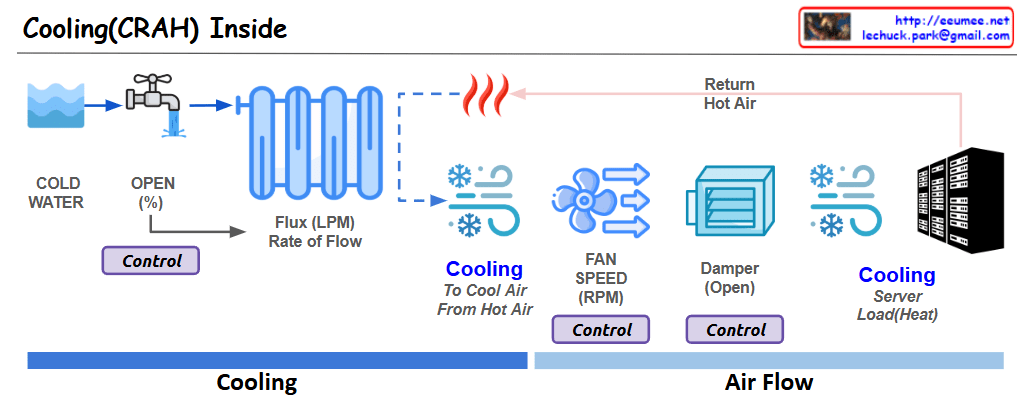
Cooling(CRAH) Inside

This image shows a diagram of the cooling system structure inside a CRAH (Computer Room Air Handler).

  1. Cooling Process Flow:
  • COLD WATER enters the system
  • Flow is controlled through an OPEN valve (%)
  • Water flows at a specified Flux rate (LPM)
  • Passes through a heat exchanger (coil)
  1. Air Circulation:
  • Return Hot Air from servers enters the system
  • Air is cooled through the heat exchanger
  • Air is circulated by fans (FAN SPEED in RPM)
  • Air volume is controlled by a Damper (Open)
  • Cooled air is supplied to the servers
  1. Key Control Elements:
  • Valve opening percentage (%)
  • Fan speed (RPM)
  • Damper position (Open)

This system illustrates the basic operating principles of a cooling system used in data centers or server rooms to effectively control server heat generation. The main purpose is to maintain appropriate temperatures by continuously removing heat (Load/Heat) generated by the servers.

The diagram efficiently shows the complete cycle from cold water intake to the cooling of hot server air and its recirculation, demonstrating how CRAH systems maintain optimal operating temperatures in data center environments.

With Claude

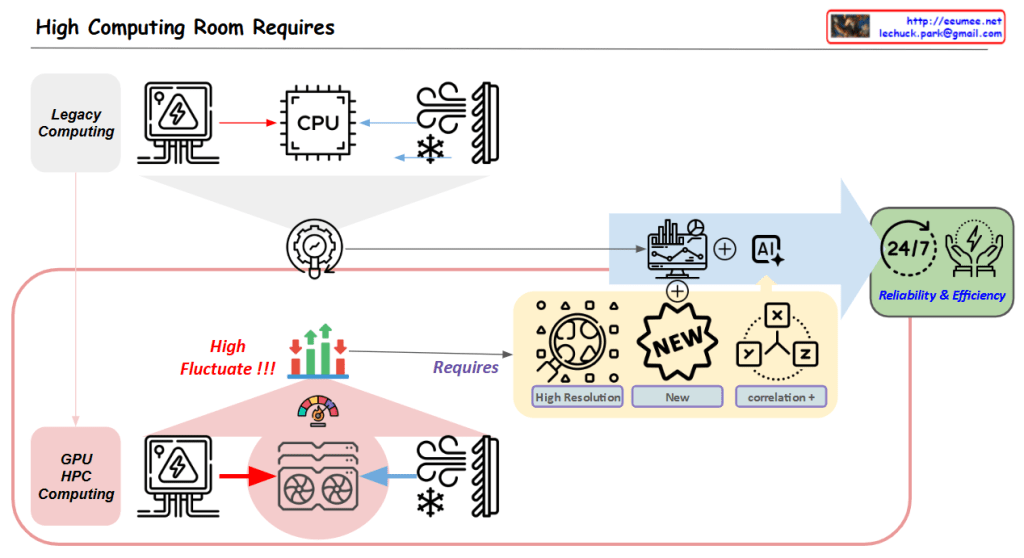
High Computing Room Requires

With a Claude’s Help
Core Challenge:

  1. High Variability in GPU/HPC Computing Room
  • Dramatic fluctuations in computing loads
  • Significant variations in power consumption
  • Changing cooling requirements

Solution Approach:

  1. Establishing New Data Collection Systems
  • High Resolution Data: More granular, time-based data collection
  • New Types of Data Acquisition
  • Identification of previously overlooked data points
  1. New Correlation Analysis
  • Understanding interactions between computing/power/cooling
  • Discovering hidden patterns among variables
  • Deriving predictable correlations

Objectives:

  • Managing variability through AI-based analysis
  • Enhancing system stability
  • Improving overall facility operational efficiency

In essence, the diagram emphasizes that to address the high variability challenges in GPU/HPC environments, the key strategy is to collect more precise and new types of data, which enables the discovery of new correlations, ultimately leading to improved stability and efficiency.

This approach specifically targets the inherent variability of GPU/HPC computing rooms by focusing on data collection and analysis as the primary means to achieve better operational outcomes.

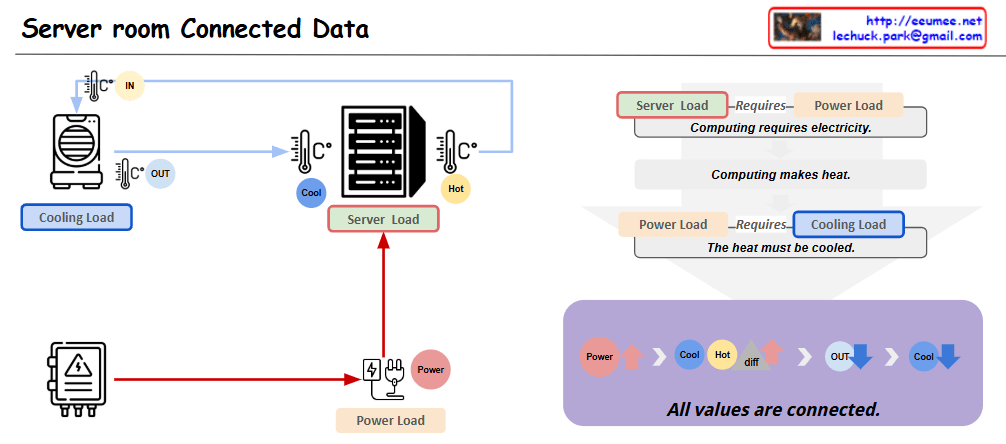
Server room Connected Data

with a claude’s help
This diagram represents the key interconnected elements within a server room in a data center. It is composed of three main components:

  1. Server Load: This represents the computing processing demand on the server hardware.
  2. Cooling Load: This represents the cooling system’s load required to remove the heat generated by the server equipment.
  3. Power Load: This represents the electrical power demand needed to operate the server equipment.

These three elements are closely related. As the Server Load increases, the Power Load increases, which then leads to greater heat generation and an increase in Cooling Load.

Applying this to an actual data center environment, important considerations would include:

  1. Server rack placement: Efficient rack arrangement to optimize cooling performance and power distribution.
  2. Hot air exhaust channels: Dedicated pathways to effectively expel the hot air from the server racks, reducing Cooling Load.
  3. Cooling system capacity: Sufficient CRAC (Computer Room Air Conditioning) units to handle the Cooling Load.
  4. Power supply: Appropriate PDU (Power Distribution Unit) to provide the necessary Power Load for stable server operation.

By accounting for these real-world data center infrastructure elements, the diagram can be further enhanced to provide more practical and applicable insights.

Overall, this diagram effectively illustrates the core interdependent components within a server room and how they relate to the actual data center operational environment.Copy