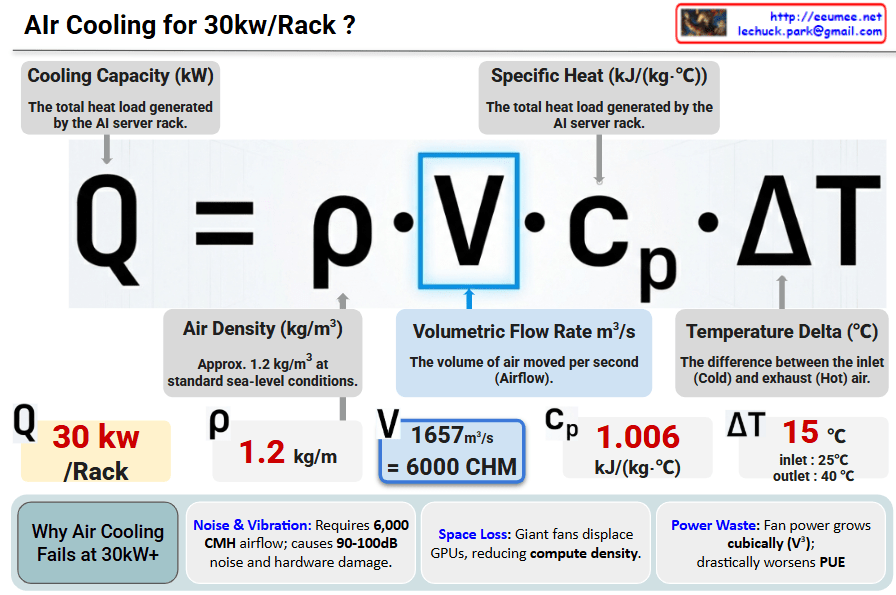
Power Waste: Fan power consumption grows cubically (V^3), causing a significant spike in PUE (Power Usage Effectiveness).
Conclusion: At 30kW/Rack, air cooling hits a physical and economic “wall”. Transitioning to Liquid Cooling is mandatory for next-generation AI Data Centers.
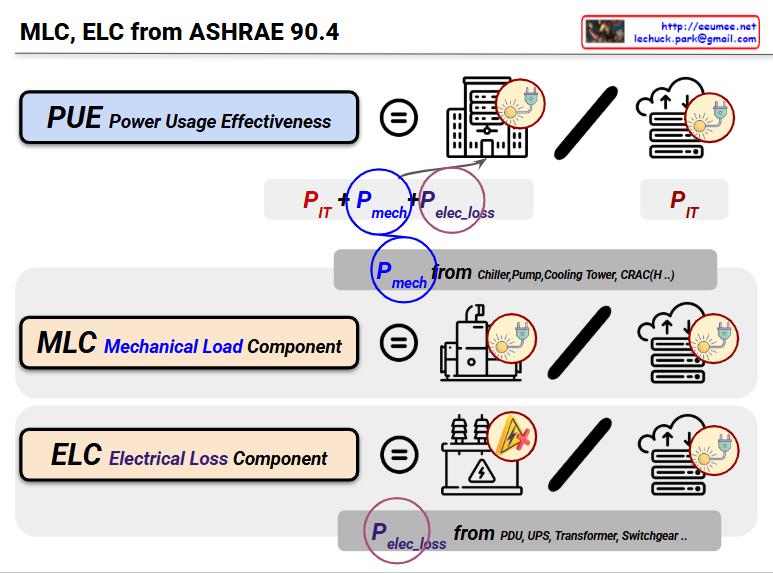
This image illustrates the concepts of PUE (Power Usage Effectiveness), MLC (Mechanical Load Component), and ELC (Electrical Loss Component) as defined in ASHRAE 90.4 standard.
Key Component Analysis:
1. PUE (Power Usage Effectiveness)
A metric measuring data center power usage efficiency
Formula: PUE = (P_IT + P_mech + P_elec_loss) / P_IT
Total power consumption divided by IT equipment power
2. MLC (Mechanical Load Component)
Ratio of mechanical load component to IT power
Formula: MLC = P_mech / P_IT
Represents how much power the cooling systems (chiller, pump, cooling tower, CRAC, etc.) consume relative to IT power
3. ELC (Electrical Loss Component)
Ratio of electrical loss component to IT power
Formula: ELC = P_elec_loss / P_IT
Represents how much power is lost in electrical infrastructure (PDU, UPS, transformer, switchgear, etc.) relative to IT power
Diagram Structure:
Each component is connected as follows:
Left: Component definition
Center: Equipment icons (cooling systems, power systems, etc.)
Right: IT equipment (server racks)
Necessity and Management Benefits:
These metrics are essential for optimizing power costs that constitute a significant portion of data center operating expenses, enabling identification of inefficient cooling and power system segments to reduce power costs and determine investment priorities.
This represents the ASHRAE standard methodology for systematically analyzing data center power efficiency and creating economic and environmental value through continuous improvement.
With a Claude’s Help This image provides detailed information on Power Usage Effectiveness (PUE), a key metric for measuring the energy efficiency of a data center.
The overall structure shows that power received from the High Power Receiver is distributed to various components, including IT equipment and cooling systems, through the Power Distributor.
To calculate PUE, several granular metrics are required, such as IT power, cooling power, and total power consumption. These detailed items are grouped into larger categories for easier management and standardization.
For example, IT power is further broken down into servers, storage, and network equipment. Cooling power includes CRAC units, cooling towers, and pump systems. The power supply stages are also differentiated to identify points of power loss.
Furthermore, detailed monitoring of individual IT and cooling equipment power consumption enables more accurate PUE calculation and optimization.
In summary, effective PUE management requires categorizing the total power usage into IT power, cooling power, and other power, and then further subdividing these groups into standardized, measurable components. Real-time monitoring and data analysis are crucial for continually improving energy efficiency in the data center.
From Claude with some prompting detailed explanation of the PUE levels :
Level 1 (Basic Measurement):
Simple power meters are used to measure the total energy consumption of the entire data center.
Measurements are done periodically or manually, which is low-cost but has lower precision.
This level only provides visibility into the overall power usage of the data center.
Level 2 (Intermediate Measurement):
Power consumption of individual IT equipment, cooling systems, and other subsystems is measured separately.
Automated software is used to collect more detailed data, providing moderate cost and mid-level precision.
This allows identifying the power usage breakdown across different subsystems.
Level 3 (Advanced Measurement):
Real-time monitoring and in-depth data analysis provide deep insights, such as power usage patterns and predictive analytics.
Additional data points like power losses and environmental monitoring are collected.
The high-precision data enables advanced optimization of the data center’s energy efficiency.
The key differences between the levels are in terms of cost, precision, and the scope of data collected. Organizations can choose the appropriate PUE measurement level based on their operational goals and budget.
From Claude with some prompting This image is a diagram explaining “Data Center Efficiency Metrics.” It visually outlines various metrics that measure the efficiency of resource usage in data centers. The key metrics are as follows:
ITUE (IT Utilization Effectiveness): Measures the ratio of useful output to input for IT equipment.
PUE (Power Usage Effectiveness): Total power consumption (IT equipment and cooling systems) divided by IT equipment power consumption.
DCIE (Data Center Infrastructure Efficiency): IT power divided by the sum of IT power and cooling power; it’s the inverse of PUE.
WUE (Water Usage Effectiveness): Water usage divided by IT power.
CUE (Carbon Usage Effectiveness): Total energy consumption multiplied by the carbon emission factor, measuring the data center’s carbon footprint.
The image also provides carbon emission factors for various energy sources (coal, natural gas, oil, wind, solar, KEPCO), showing how the energy source impacts carbon emissions.
This diagram helps data center operators comprehensively evaluate and improve their efficiency in terms of power, cooling, water usage, and carbon emissions. From my analysis, the content of this image is accurate and effectively explains the standard metrics for measuring data center efficiency.