With a Claude’s Help
this image about Linux mlock (memory locking):
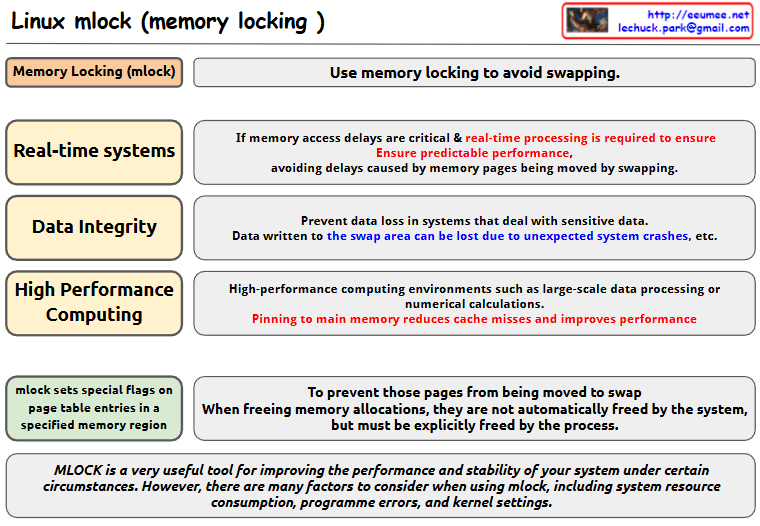
- Basic Concept
- mlock is used to avoid memory swapping
- It sets special flags on page table entries in specified memory regions
- Main Use Cases
- Real-time Systems
- Critical for systems where memory access delays are crucial
- Ensures predictable performance
- Prevents delays caused by memory pages being moved by swapping
- Data Integrity
- Prevents data loss in systems dealing with sensitive data
- Data written to swap areas can be lost due to unexpected system crashes
- High Performance Computing
- Used in environments like large-scale data processing or numerical calculations
- Pinning to main memory reduces cache misses and improves performance
- Implementation Details
- When memory locations are freed using mlock, they must be explicitly freed by the process
- The system does not automatically free these pages
- Important Note mlock is a very useful tool for improving system performance and stability under certain circumstances. However, users need to consider various factors when using mlock, including:
- System resource consumption
- Programme errors
- Kernel settings
This tool is valuable for system optimization but should be used carefully with consideration of these factors and requirements.
The image presents this information in a clear diagram format, with boxes highlighting each major use case and their specific benefits for system performance and stability.Copy