Linux with ML

From Claude with some prompting
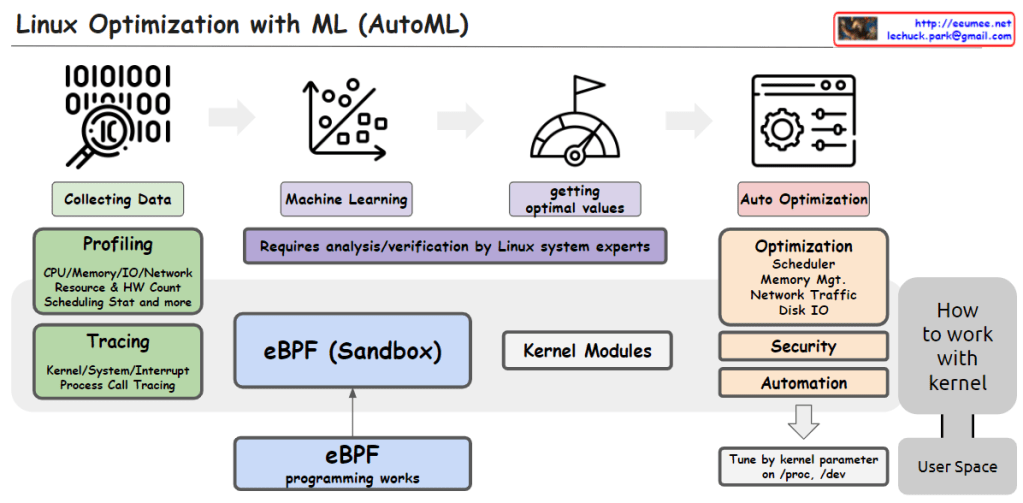
This image illustrates the process of utilizing Machine Learning (ML) and AutoML techniques for system optimization in Linux.

It starts with collecting data through profiling techniques that gather statistics on CPU, memory, I/O, network resource usage, hardware counters, scheduling information, etc. Tracing is also employed to capture kernel/system/interrupt events and process call traces.

The collected data is then used to train machine learning models. This step requires analysis and verification by Linux system experts.

The trained models help determine optimal values, which are then applied to optimize various system components such as the scheduler, memory management, network traffic, and disk I/O. Optimization can also target security and automation aspects.

The eBPF (Enhanced Berkeley Packet Filter) sandbox, situated in the center, allows safe execution within the kernel, enabling eBPF programs to interact with the kernel.

Kernel modules provide another way to implement optimization logic and integrate it directly into the kernel.

Finally, kernel parameters can be tuned from user space to perform optimizations.

In summary, the image depicts an AutoML-based process that leverages data collection, machine learning modeling, deriving optimal values, eBPF, kernel modules, and parameter tuning to automate system optimization in Linux across various kernel subsystems like the scheduler, memory management, network, and disk I/O.C

KASAN @ linux kernel

From Gemini with some prompting
The image you provided depicts a diagram illustrating the operation of Kernel Address Sanitizer (KASAN) in the Linux kernel. KASAN is a memory sanitizer tool that aims to detect memory corruption errors, particularly those related to out-of-bounds reads/writes and use-after-free vulnerabilities.

Key Elements of the Diagram:

  1. Memory Accessing: This section represents the various ways in which memory is accessed within the kernel. It includes both valid and invalid access patterns.
  2. For All Memory: This indicates that KASAN monitors memory accesses for all allocated memory regions, regardless of their purpose or usage.
  3. Shadow Memory: This represents a dedicated memory space, typically 1/8th of the total physical memory, allocated by KASAN to store information about memory accesses.
  4. Violation Detection: This section highlights the core function of KASAN, which is to detect and report invalid memory access attempts.
  5. Use-after-free Detection: This specifically refers to KASAN’s ability to identify attempts to access memory regions that have already been freed, preventing potential memory corruption issues.
  6. Out-of-Bounds Read/Write: This emphasizes KASAN’s capability to detect memory accesses that exceed the boundaries of the allocated memory regions, safeguarding against buffer overflows and other memory-related vulnerabilities.

Overall Interpretation:

The diagram effectively illustrates the fundamental concept of KASAN: monitoring memory accesses, maintaining a shadow memory space for access information, and detecting invalid access patterns to prevent memory corruption errors.

Resource limitation of processes

From DALL-E with some prompting

This image represents a concept diagram for ‘Control Groups’ (Cgroups) used in the Linux operating system. Cgroups provide the capability to manage and limit system resource usage for groups of processes. Each control group can have limits set for various resources such as CPU, memory, block I/O, and network bandwidth.

Groups A, B, C: Each circle represents a separate control group, and the gear icons within each group symbolize the processes assigned to that group.

The central graphical elements represent various system resources:

CPU: Represents CPU time and usage (milliseconds, percentage).
Memory (RAM): Shows total memory usage, memory usage ratio, and memory usage limit.
Block I/O: Illustrates disk read/write speed, number of input/output operations per second (IOPS), and latency.
Network Bandwidth: Displays transmission speed and bandwidth usage ratio.
In the upper right, there’s a section with the text “Resource limits per group” alongside icons for each resource and a question-marked group. This likely illustrates the resource limitations that can be set for each control group.

At the bottom, “Linux 2.6.24 +” indicates that the Cgroups feature is available from Linux kernel version 2.6.24 onwards.

Overall, the image seems to have been created to explain the concept of Cgroups and how resources can be managed for different groups within a system.


Linux RUN LEVEL

From DALL-E with some prompting
The image describes the Linux Run Levels, which are modes of operation in Unix-like operating systems. It explains the directories /etc/rcX.d where X is the run level number, and /etc/init.d which contains the original script files. The various levels are highlighted:

  • Level 0: Halt the system.
  • Level 1: Single user mode.
  • Level 2: Single user mode without networking.
  • Level 3: Single user mode with networking.
  • Level 4: Unused.
  • Level 5: Multi-user mode with networking and GUI.
  • Level 6: Reboot.

Scripts starting with S are used to start services, and those starting with K are used to stop services. The scripts are symbolically linked and have a naming convention that usually starts with S or K followed by a number indicating the order of execution.

Kernel Same-page Merging

From DALL-E with some prompting
Kernel Same-page Merging (KSM) is a feature within an operating system’s kernel that enhances memory efficiency by identifying and merging identical memory pages. Typically, this process is beneficial for duplicated pages from executable files and shared libraries, which are common across different processes. KSM is also advantageous in environments where there is a significant amount of shared data and memory-mapped files, such as virtualization systems where multiple virtual machines may be running the same operating system or similar applications. By merging these pages, KSM allows for a reduction in physical memory usage, leading to better memory management and potentially improved performance for the system.

Read-copy update

From DALL-E with some prompting
The image explains the “Read-Copy Update” mechanism, illustrating the process of reading and writing data in concurrent programming divided into two parts.

The left section, accompanied by the phrase “Easy to Read,” shows arrows from three gear icons pointing towards a document icon. This represents the “Wait-Free Reads” process, indicating that multiple threads can read data simultaneously without waiting.

The right section, labeled “Complex to Write,” demonstrates that the writing process is more complicated. During the “Grace Period,” the old data can still be read, but after copying is finished, the new data is read. During this period, the old data is subject to “Old → Garbage Collection,” meaning it will be discarded through garbage collection. This mechanism ensures that data reads are not blocked while the data is being updated.

The Read-Copy Update is a strategy used in systems handling concurrency to maintain data consistency while optimizing the performance of read operations. Although the process of writing data is complex, the mechanism is designed to allow reads to be simple and fast.