Understanding and Predicting

From Claude with some prompting
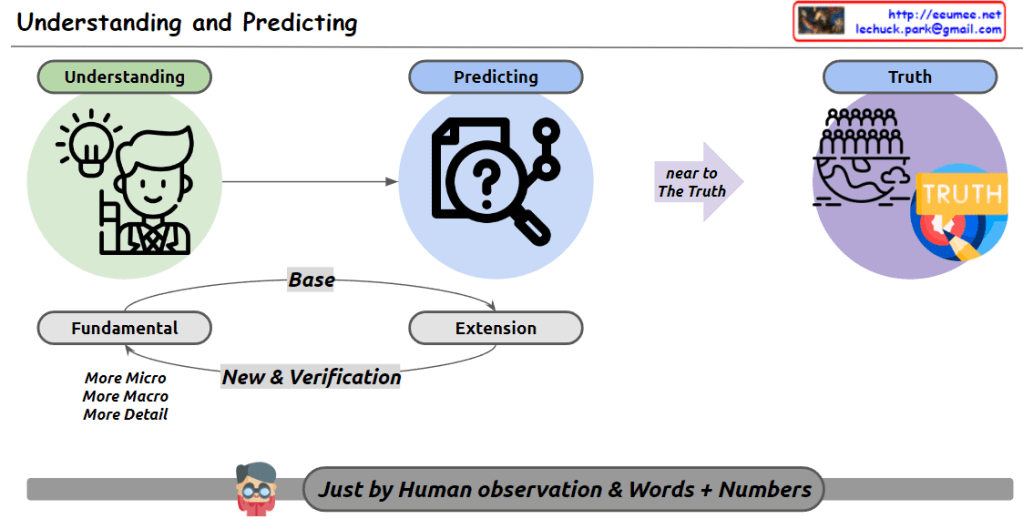
This image illustrates the human process of approaching truth through understanding and prediction. The key components are:

  1. Understanding: Represented by a lightbulb and a human icon, signifying the acquisition of basic knowledge.
  2. Predicting: Symbolized by a magnifying glass with a question mark, indicating the stage where understanding is used to make predictions.
  3. Truth: Depicted by a group of people and a “TRUTH” label, representing the ultimate goal.

These elements are connected sequentially, with prediction aiming to get “near to the Truth.”

The process is built on two foundational concepts:

  • Fundamental
  • Extension

These concepts interact through “New & Verification,” with the fundamental aspect encompassing “More Micro, More Macro, More Detail.”

Key Insights:

  1. Continuous Approach to Truth: Humans are constantly moving towards truth through understanding and prediction. This is a dynamic process, not a static one.
  2. Knowledge Expansion and Refinement: We expand our knowledge by exploring fundamental concepts more microscopically, macroscopically, and in greater detail. This represents growth in both depth and breadth of human knowledge.
  3. Limitations of Human Perception: The phrase “Just by Human observation & Words” at the bottom of the image highlights a fundamental limitation. We can only understand and express the world through our observations and language, not through direct access to matter itself.
  4. Role and Limitations of Numbers: While mathematical expressions can help overcome some linguistic limitations, they too face boundaries when confronting the infinite complexity of the microscopic and macroscopic worlds.
  5. Infinite Nature of Knowledge: As we learn more, we discover there is even more to learn. This paradox suggests an endless journey of discovery and understanding.
  6. Dynamic Process: The pursuit of knowledge is ongoing and ever-evolving, constantly expanding and becoming more refined.

In conclusion, this image portrays the continuous human quest for knowledge and truth, acknowledging our perceptual and expressive limitations while emphasizing our persistent efforts to expand and deepen our understanding of the world around us.

Everything is

From Claude with some prompting
This diagram titled “Everything is” illustrates the process of human perception and understanding:

  1. “Input” represents all information received through human senses, depicted by a group of people icons and various symbols.
  2. This input connects to “EVERYTHING”, suggesting that we perceive the world through our senses.
  3. The note “Only Meaning Very very small” indicates that the initial meaning of information at the input stage is limited.
  4. The “More & More” box represents the expansion of human understanding through two methods:
    • “Logics”: Human thought processes
    • “Auto Logics”: AI or automated thinking processes
  5. “More Micro” and “More Macro” arrows show that this expanded thinking develops into more microscopic and macroscopic perspectives.

In essence, this diagram portrays how humans receive information through their senses and process it using both human logical thinking and automated thinking (like AI). This continuous process expands our understanding of the world, allowing us to comprehend “EVERYTHING” from increasingly detailed (micro) and broad (macro) viewpoints. The diagram illustrates our journey towards a deeper and wider understanding of everything around us.

AI vs Human

From Claude with some prompting
Sure, here’s an explanation of the image in English, with a detailed description of the graph’s contents:

This image contrasts the capabilities of rule-based human logic and data-driven AI. The graph shows two curves:

  1. The blue curve represents rule-based human logic, which is stated to be “Always 100%” accurate. However, the curve flattens out, indicating that as data volume increases, human logic reaches its limits and analysis stagnates.
  2. The purple curve represents data-driven AI output, which starts at 0% accuracy but increases “dramatically based on more data” as computing power increases. The curve asymptotically approaches but never quite reaches 100%, with values like 99.99%, 99.999% mentioned.

The key points made are:

  • Rule-based human logic is 100% accurate but limited in its ability to process excessive data volumes.
  • Data-driven AI has lower initial accuracy but can approach near-perfect accuracy (99.99%+) by analyzing vast amounts of data powered by immense computing capabilities.
  • As more data and computing power become available, the effectiveness of data-driven AI surpasses the limits of human logic analysis.

So the image suggests that while human logic is perfect within its constraints, the future lies with data-driven AI systems that can harness massive data and computing resources to deliver extremely high accuracy, potentially exceeding human capabilities.


AI operation By Humans

From Claude with some prompting
This image illustrates a process called “Data Center AI Operation by Humans (Experts).” It depicts the various stages involved in utilizing artificial intelligence (AI) to analyze and optimize data center operations while ensuring that human experts have the final decision-making authority.

The process starts with data collection from various sources like servers and automation systems. This data is then verified and converted into a digital format suitable for analysis by AI algorithms. The AI system performs analysis and generates insights, which are combined with the data center processes to suggest optimizations.

However, before implementing any changes, human experts knowledgeable in data and AI review and finalize all decisions. This approach aims to leverage AI’s analytical capabilities while maintaining human expertise and oversight for critical operational decisions in the data center.

The image emphasizes that while AI acts as an “accelerator” for digitalization and analysis, the ultimate operation is carried out by human experts who understand the nuances of data and AI to ensure effective and responsible decision-making.

Digitalization

From DALL-E with some prompting
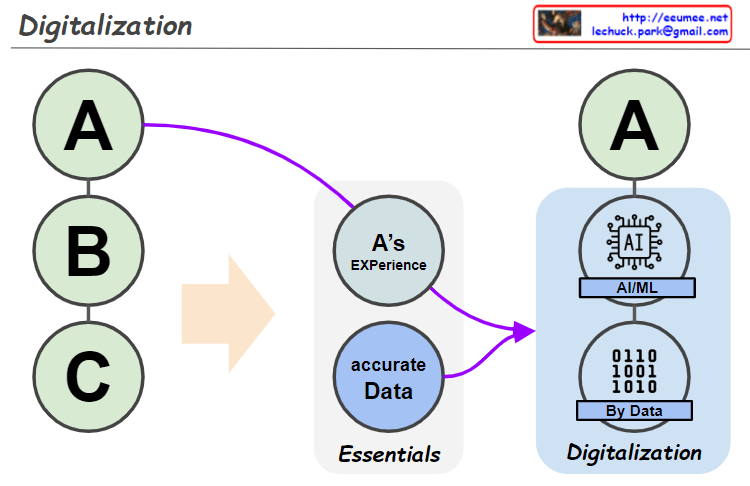
The image depicts three levels of experience, A, B, and C, highlighting that while A represents a high level of experience, levels B and C can be enhanced through digital transformation using data and AI technologies. This transformation underscores that the collection and analysis of accurate data are essential elements, as they lay the foundation for AI systems to perform sophisticated learning, thus improving operational efficiency and precision.

The integration of individual experiences and precise data is not merely a technical shift but also prompts significant changes in human resource management within organizations. By incorporating their expertise into digital platforms, employees can strengthen the organization’s knowledge base and contribute to their own professional development.

Ultimately, this digital transformation should be sustainable and maintain a human-centric approach, ensuring that the increase in operational efficiency through AI alleviates the workload on employees, fostering creativity and enhancing the organizational culture and values.


3 for Datacenter

From DALL-E with some prompting
This image visually represents “3 Key Strategies for DC Operation.”

  1. Transform
    • Digitalization: Transitioning data centers to digital technology.
      • KPI (Key Performance Indicators)
      • PUE (Power Usage Effectiveness) & Monitoring
      • Automation
      • Data API Service
  2. Use
    • Data Platform: Establishing platforms for data management and utilization.
      • Standardization
      • Platform
      • Continuous Upgrade
      • New!!
  3. Verify
    • AI: Validating efficiency and performance of data centers through AI.
      • Real AI
      • Early Warning
      • Energy Operation

These three strategies are interconnected with three objectives: “Experience to Digital,” “Continuous Innovation,” and “AI DC Now!!” This illustrates that the operation of data centers is moving towards impacting humans through digitalization, innovation, and the application of AI technology, driving transformation across the industry.

Perfect 1 ??

From the bard with some prompting
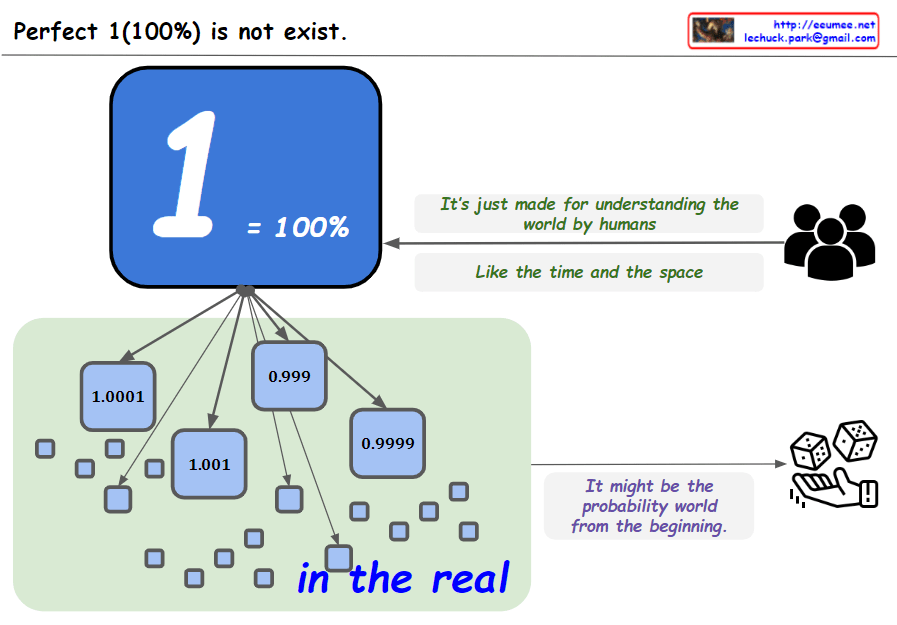
The image you provided consists of 10 squares with numbers from 1 to 0.9999, along with the phrase “Perfect 1 (100%) does not exist.”

The image conveys the message that perfection is impossible. The 10 squares represent 100%, but it is impossible to reach 100%, no matter how close we get. The number 0.9999 in the last square shows that it is close to perfection, but ultimately not perfect.

The image can also convey the message that the real world is uncertain and unpredictable. There is nothing that we can be 100% sure of, and there is always some uncertainty.

Finally, the image can convey the message that we are always growing and learning. The numbers from 1 to 0.9999 show that we are always getting closer to perfection, but we are never perfect.

The image is an open image that can be interpreted in many ways. Each individual can interpret the image according to their own experiences and values.

Here are some specific interpretations of the image:

Perfection is impossible: No matter how hard we try, we will never be perfect. There will always be room for improvement.
The real world is uncertain: There is always some risk or uncertainty in life. We cannot control everything that happens.
We are always growing and learning: We are constantly learning and evolving. We can always strive to be better.
Ultimately, the meaning of the image is up to the individual to decide.