Eventlog with LLM

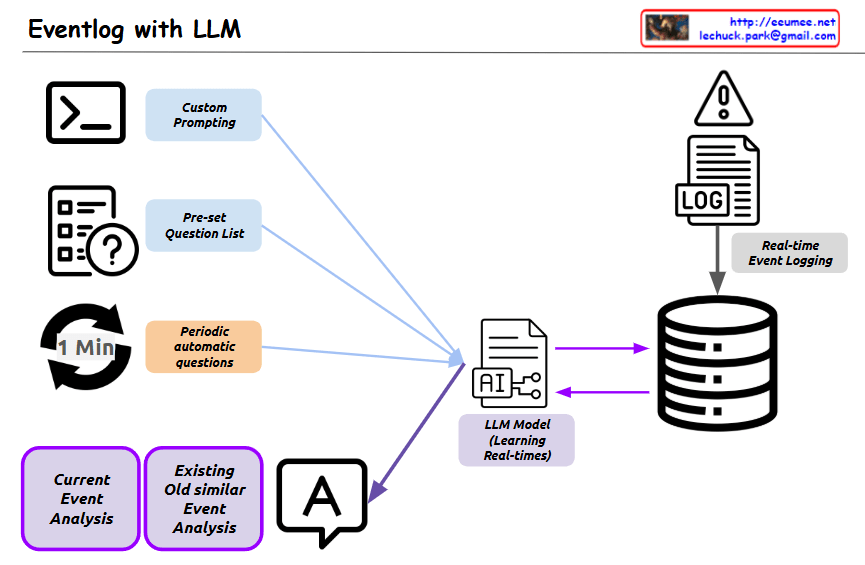
  1. Input methods (left side):
    • A command line/terminal icon with “Custom Prompting”
    • A questionnaire icon with “Pre-set Question List”
    • A timer icon (1 Min) with “Periodic automatic questions”
  2. Processing (center):
    • An “LLM Model” component labeled as “Learning Real-times”
    • Database/storage components for “Real-time Event Logging”
  3. Output/Analysis (bottom):
    • Two purple boxes for “Current Event Analysis” and “Existing Old similar Event Analysis”
    • A text/chat bubble showing output

This system collects and updates unstructured text-based event logs in real-time, which are then learned by the LLM. Through user-input questions, predefined question lists, or periodically auto-generated questions, the system analyzes current events and compares them with similar past cases to provide comprehensive analytical results.

The primary purpose of this system is to efficiently process large volumes of event logs from increasingly large and complex IT infrastructure or business systems. This helps operators easily identify important events, make quick judgments, and take appropriate actions. By leveraging the natural language processing capabilities of LLMs, the system transforms complex log data into meaningful insights, significantly simplifying system monitoring and troubleshooting processes.

With Claude

Analog to Digital & Analysis

With Claude
Here’s the analysis of the image and key elements :

  1. Sampling Stage
  • Initial stage of converting analog signals to digital values
  • Converts analog waveforms from sensors into digital data (0110 1001 1010)
  • Critical first step that determines data quality
  • Foundation for all subsequent processing
  1. Resolution Stage
  • Determines data quality through Data density and Sampling rate
  • Direct impact on data precision and accuracy
  • Establishes the foundation for data quality in subsequent analysis
  • Controls the granularity of digital conversion
  1. How to Collect
  • Pooling: Collecting data at predetermined periodic intervals
  • Event: Data collection triggered by detected changes
  • Provides efficient data collection strategies based on specific needs
  • Enables flexible data gathering approaches
  1. Analysis Quality
  • NO error: Ensures error-free data processing
  • Precision: Maintains high accuracy in data analysis
  • Realtime: Guarantees real-time processing capability
  • Comprehensive quality control throughout the process

Key Importance in Data Collection/Analysis:

  1. Accuracy: Essential for reliable data-driven decision making. The quality of input data directly affects the validity of results and conclusions.
  2. Real-time Processing: Critical for immediate response and monitoring, enabling quick decisions and timely interventions when needed.
  3. Efficiency: Proper selection of collection methods ensures optimal resource utilization and cost-effective data management.
  4. Quality Control: Consistent quality maintenance throughout the entire process determines the reliability of analytical results.

These elements work together to enable reliable data-driven decision-making and analysis. The success of any data analysis system depends on the careful implementation and monitoring of each component, from initial sampling to final analysis. When properly integrated, these components create a robust framework for accurate, efficient, and reliable data processing and analysis.

Prediction & Detection

From Claude with some prompting
This image illustrates a Prediction and Detection system for time series data. Let me break down the key components:

  1. Left Large Box (Learning and Prediction Section):
  • Blue line: Actual Temperature data
  • Red dotted line: Predicted Temperature data
  • Uses time series prediction models like LSTM, ARIMA, and Prophet for learning
  1. Top Right (Threshold-based Anomaly Detection):
  • “Abnormal Detection with Threshold”
  • Detects abnormal temperature changes based on threshold values
  • The area marked with a red circle shows where values exceed the threshold
  • Includes “Warning” and “Critical” threshold levels
  1. Bottom Right (Pattern-based Anomaly Detection):
  • “Anomaly Detection with Predict-Pattern”
  • Compares predicted patterns with actual data to detect anomalies
  • The area marked with a green circle shows where actual data deviates from the predicted pattern

The system detects anomalies in two ways:

  1. When values exceed predetermined thresholds
  2. When actual data significantly deviates from predicted patterns

This type of system is particularly useful in:

  • Industrial monitoring
  • Equipment maintenance
  • Early warning systems
  • Quality control
  • System health monitoring

The combination of prediction and dual detection methods (threshold and pattern-based) provides a robust approach to identifying potential issues before they become critical problems.

Change & Prediction

From Claude with some prompting
This image illustrates a process called “Change & Prediction” which appears to be a system for monitoring and analyzing real-time data streams. The key components shown are:

  1. Real-time data gathering from some source (likely sensors represented by the building icon).
  2. Selecting data that has changed significantly.
  3. A “Learning History” component that tracks and learns from the incoming data over time.
  4. A “Trigger Point” that detects when data values cross certain thresholds.
  5. A “Prediction” component that likely forecasts future values based on the learned patterns.

The “Check Priorities” box lists four criteria for determining which data points deserve attention: exceeding trigger thresholds, predictions crossing thresholds, high change values, and considering historical context.

The “View Point” section suggests options for visualizing the status, grouping related data points (e.g., by location or service type), and showing detailed sensor information.

Overall, this seems to depict an automated monitoring and predictive analytics system for identifying and responding to important changes in real-time data streams from various sources or sensors.

Event & Alarm

From DALL-E with some prompting

The image illustrates the progressive stages of detecting alarm events through data analysis. Here’s a summary:

  1. Internal State: It shows a machine with an ‘ON/OFF’ state, indicating whether the equipment is currently operating.
  2. Numeric & Threshold: A numeric value is monitored against a set threshold, which can trigger an alert if exceeded.
  3. Delta (Changes) & Threshold: A representation of an alert triggered by significant changes or deviations in the equipment’s performance, as compared to a predefined threshold.
  4. Time Series & Analysis: This suggests that analyzing time-series data can identify trends and forecast potential issues.
  5. Machine Learning: Depicts the use of machine learning to interpret data and build predictive models.
  6. More Predictive: The final stage shows the use of machine learning insights to anticipate future events, leading to a more sophisticated alarm system.

Overall, the image conveys the evolution of alarm systems from basic monitoring to advanced prediction using machine learning.


Network Monitoring with AI

from DALL-E with some prompting
The image portrays a network monitoring system enhanced by AI, specifically utilizing deep learning. It shows a flow from the network infrastructure to the identification of an event, characterized by computed data with time information and severity. The “One Event” is clearly defined to avoid ambiguity. The system identifies patterns such as the time gap between events, event count, and relationships among devices and events, which are crucial for a comprehensive network analysis. AI deep learning algorithms work to process additional data (add-on data) and ambient data to detect anomalies and support predictive maintenance within the network.

Mech control & data system HA concepts

From DALL-E with some prompting
This diagram illustrates the High Availability (HA) configuration of a system designed to collect and utilize data for controlling equipment. Notably, the ‘Transactions Rates’ and ‘Machine Perf’ data collected from the equipment are not high-resolution, real-time streams but rather have a lower resolution on a per-second basis. This characteristic indicates that the depicted HA concept can adequately handle the data processing requirements of the equipment. The system offers load balancing and high availability through ‘Clustering’ and ensures uninterrupted service by automatically switching to a backup system via ‘Failover Logic’ in case of any failure. ‘Req/Res’ handles the request and response processes, ‘Data From Active’ indicates data collected from the active system, and ‘Active Only Noti’ manages notifications that occur only in the active state. Thus, the system is capable of operating continuously and reliably within the constraints of the equipment’s data processing level.