IF/THEN with AI/DT

From DALL-E with some prompting
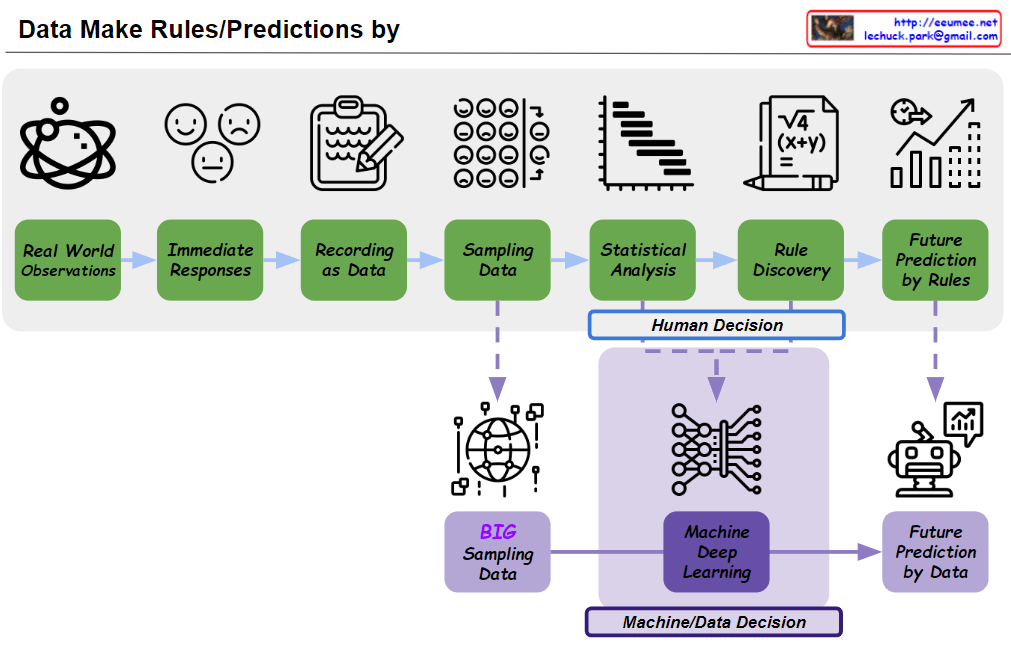
The image depicts the evolution of decision-making processes from manual to automated, facilitated by AI and Digital Transformation (DT). Initially, decisions were made by humans based on specific conditions (IF condition THEN action). This manual approach did not involve computing. With DT, the process becomes automated through computing, making it faster and more efficient. The transition to AI and Machine Learning (ML) marks a further evolution where decisions are not just automated but are also data-driven, increasing accuracy and the ability to adapt to complex situations. The visual suggests a shift from human-based decision-making to a more sophisticated, automated, and intelligent system of processing and action-taking, indicative of modern advancements in technology.

Data Make RULES

From DALL-E with some prompting
The image depicts the evolution of the decision-making process from data collection to conclusion. Where decisions were once made entirely by humans before the advent of AI/ML, the progress in big data processing and machine learning/deep learning now allows machines or the data itself to make decisions. Initially, the process was human-centric, starting from real-world observations to data recording, followed by statistical analysis and rule discovery to predict the future. With advancements, we now extract large samples from large datasets and utilize deep learning to recognize complex patterns, leading to a machine-centric process that predicts the future based on data. This shift emphasizes the power of data and the significance of machine learning.

Unchanging data

from DALL-E with some prompting
The image illustrates a process of monitoring typically unchanging data to detect system malfunctions. The ‘Traffic / User(s)’ data reflects the relative amount of traffic between two connected users, which generally remains constant. The heat generated by the CPU, as well as electrical elements like voltage and current, are also considered unchanging data in a stable state. A fault detection sensor sends an alert when anomalies are detected in these data points. The ‘Detect it!!’ sensor shows no changes under normal conditions but identifies deviations when an event occurs, enabling a response to potential issues.

maintain 1

From DALL-E with some prompting
The image contrasts the concept of maintaining the number “1” in the digital world versus the real world.

  • In the Digital World: The “1” represented in binary code is said to be very easy to maintain in the digital realm, implying that as long as there is electricity, the data “1” can be precisely preserved.
  • In the Real World: It questions the existence of a perfect “1,” showing values like 0.99999 and 1.00001 around the numerical representation of “1,” suggesting that maintaining an absolute “1” in the real world is challenging.
  • The phrases “Everything is Changed” and “Everything is Connected” at the bottom emphasize that in the real world, everything is subject to change and interconnected.

Overall, the image presents a philosophical inquiry into how the concept of “1” can be applied and interpreted differently between the digital and real worlds. While the digital world can uphold the accuracy and consistency of data, the real world embeds complexities and nuances within the concept of constancy.

All data is connected

from DALL-E with some prompting
This image illustrates that key metrics generated from computing activities (such as power, CPU performance, memory usage, heat, and cooling power), data traffic, and user behavior (e.g., IP addresses) are interconnected. These metrics influence one another and their interactions can provide insights into the overall state of the system. The linear regression equation at the bottom of the image represents a simple mathematical model for analyzing and predicting the relationships between these metrics, suggesting how they can be numerically understood and connected.

Mech control & data system HA concepts

From DALL-E with some prompting
This diagram illustrates the High Availability (HA) configuration of a system designed to collect and utilize data for controlling equipment. Notably, the ‘Transactions Rates’ and ‘Machine Perf’ data collected from the equipment are not high-resolution, real-time streams but rather have a lower resolution on a per-second basis. This characteristic indicates that the depicted HA concept can adequately handle the data processing requirements of the equipment. The system offers load balancing and high availability through ‘Clustering’ and ensures uninterrupted service by automatically switching to a backup system via ‘Failover Logic’ in case of any failure. ‘Req/Res’ handles the request and response processes, ‘Data From Active’ indicates data collected from the active system, and ‘Active Only Noti’ manages notifications that occur only in the active state. Thus, the system is capable of operating continuously and reliably within the constraints of the equipment’s data processing level.