Server Room Cooling Metrics

This dashboard is designed to monitor the comprehensive performance of server room cooling systems by displaying temperature changes alongside server power consumption data, while also tracking water flow rate (Water LPM) and fan speed. The main utilities and applications of this approach include:

  1. Integrated Data Visualization:
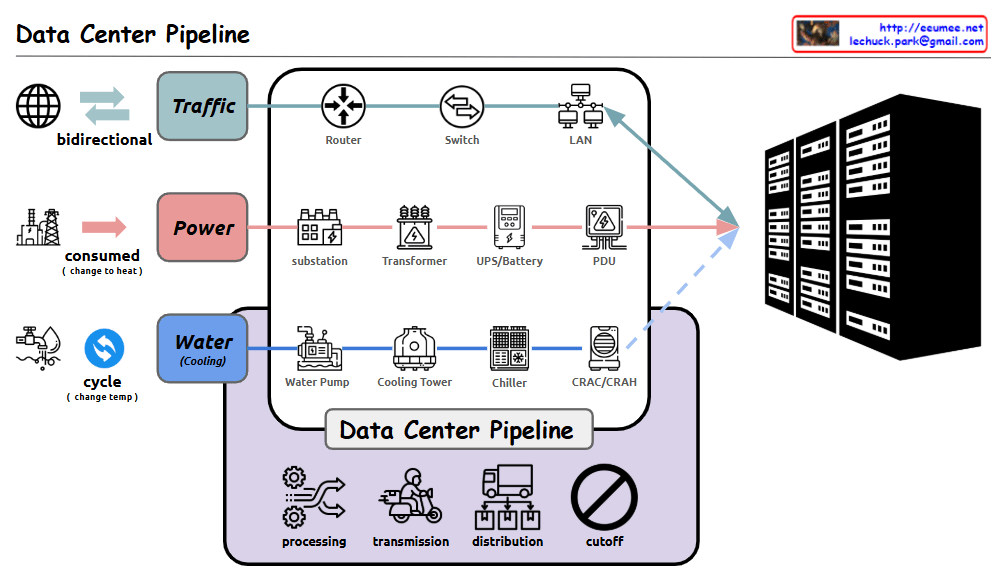
    • Enables simultaneous monitoring of temperature, power consumption, and cooling system parameters (flow rate, fan speed) in a single dashboard, facilitating the identification of correlations between systems.
    • Allows operators to immediately observe how increases in power consumption lead to temperature rises and the subsequent response of cooling systems.
  2. Benefits of Heat Map Implementation:
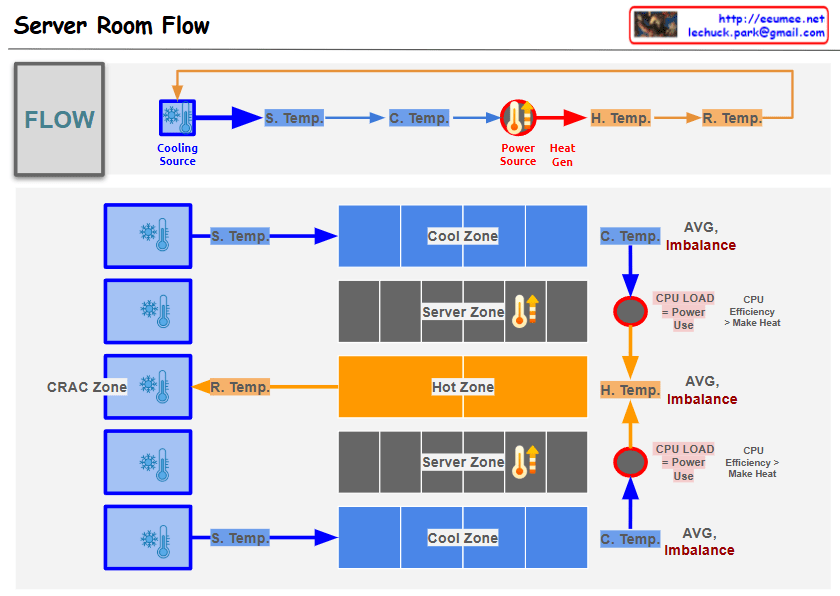
    • Represents data from multiple temperature sensors categorized as MAX/MIN/AVG with color differentiation, providing intuitive understanding of spatial temperature distribution.
    • Creates clear visual contrast between yellow (HOTZONE) and blue (COOLZONE) areas, making temperature gradients easily recognizable.
    • Enables quick identification of temperature anomalies for early detection of potential issues.
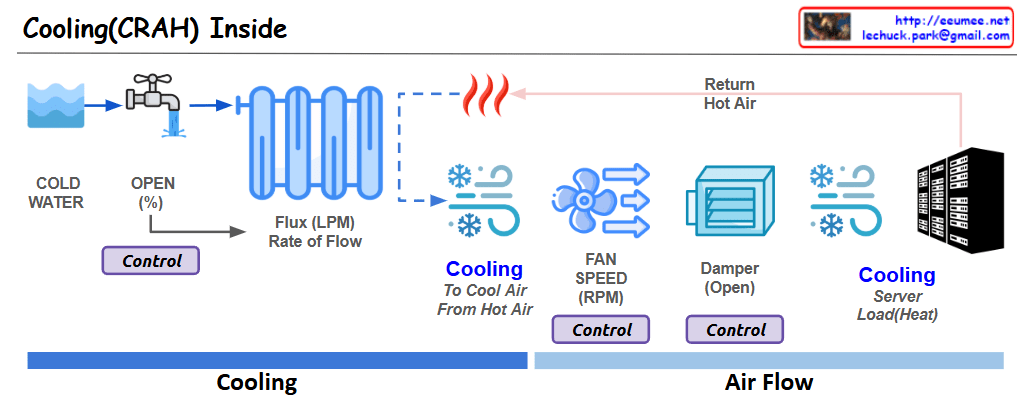
  3. Cooling Efficiency Monitoring:
    • Facilitates analysis of the relationship between Water LPM (water flow rate) and temperature changes to evaluate cooling water usage efficiency.
    • Allows assessment of air circulation system effectiveness by examining correlations between fan speed and COOLZONE/HOTZONE temperature changes.
    • Enables real-time monitoring of heat exchange efficiency through the difference between RETURN TEMP and SUPPLY TEMP.
  4. Event Detection and Analysis:
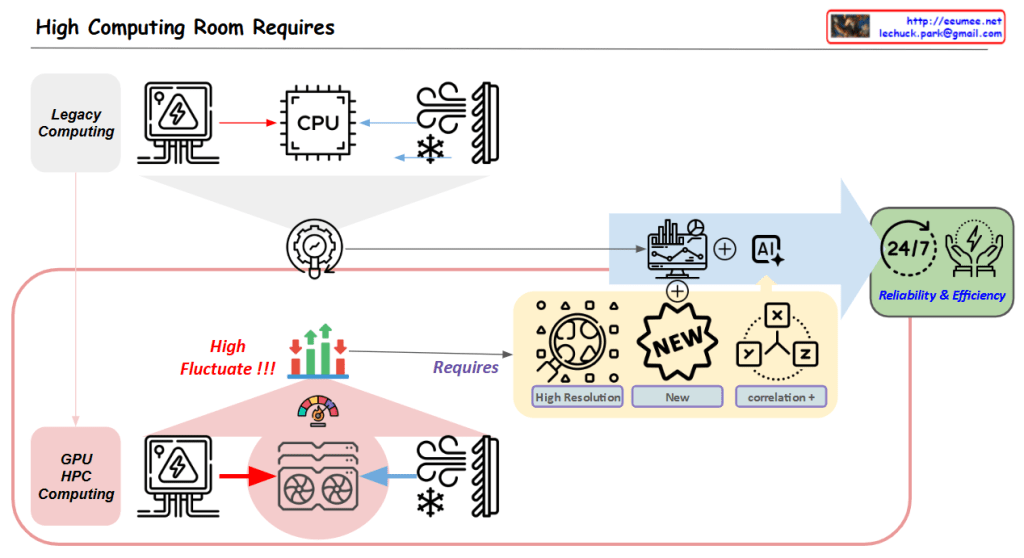
    • Features an “EVENT(Big Change?)” indicator that helps quickly identify significant changes or anomalies.
    • Displays data from the past 30 minutes in 5-minute intervals, enabling analysis of short-term trends and patterns.
  5. Operational Decision Support:
    • Provides immediate feedback on the effects of cooling system adjustments (changes in flow rate or fan speed) on temperature, enabling optimization of operational parameters.
    • Helps evaluate the response capability of cooling systems during increased server loads, supporting capacity planning.
    • Offers necessary data to balance energy efficiency with server stability.

This dashboard goes beyond a simple monitoring tool to serve as a comprehensive decision support system for optimizing thermal management in server rooms, improving energy efficiency, and ensuring equipment stability. The heat map visualization approach, in particular, makes complex temperature data intuitively interpretable, allowing operators to quickly assess situations and respond appropriately.

With Claude

Cooling(CRAH) Inside

This image shows a diagram of the cooling system structure inside a CRAH (Computer Room Air Handler).

  1. Cooling Process Flow:
  • COLD WATER enters the system
  • Flow is controlled through an OPEN valve (%)
  • Water flows at a specified Flux rate (LPM)
  • Passes through a heat exchanger (coil)
  1. Air Circulation:
  • Return Hot Air from servers enters the system
  • Air is cooled through the heat exchanger
  • Air is circulated by fans (FAN SPEED in RPM)
  • Air volume is controlled by a Damper (Open)
  • Cooled air is supplied to the servers
  1. Key Control Elements:
  • Valve opening percentage (%)
  • Fan speed (RPM)
  • Damper position (Open)

This system illustrates the basic operating principles of a cooling system used in data centers or server rooms to effectively control server heat generation. The main purpose is to maintain appropriate temperatures by continuously removing heat (Load/Heat) generated by the servers.

The diagram efficiently shows the complete cycle from cold water intake to the cooling of hot server air and its recirculation, demonstrating how CRAH systems maintain optimal operating temperatures in data center environments.

With Claude

Server Room Flow

With Claude
Comprehensive Analysis of Server Room HVAC System Configuration and Operation

  1. Physical Configuration
  • Multiple cooling units arranged in CRAC (Computer Room Air Conditioning) Zone
  • Three-tier structure: Cool Zone, Server Zone, Hot Zone
  • Upper and lower distribution structure for air circulation
  1. Temperature Monitoring System
  • Supply Temperature (S. Temp): Cooling unit output temperature
  • Cooling Zone Temperature (C. Temp): Pre-server intake temperature
  • Hot Zone Temperature (H. Temp): Server exhaust temperature
  • Return Temperature (R. Temp): CRAC intake temperature
  1. Efficiency Management Indicators
  • AVG. Imbalance monitoring for each section
  • CPU load and power consumption correlation analysis
  • CPU efficiency and heat generation relationship tracking
  1. Analysis Points
  • Delta T analysis between sections
  • Temperature variation patterns by time/season
  • Power efficiency and cooling efficiency correlation
  • System stability prediction indicators
  1. Operational Goals
  • Operating cost optimization
  • Provide stable server operating environment
  • Energy-efficient cooling system operation
  • Proactive problem detection and response

Data Center Supply

With Claude
The supply system in data centers follows a unified control flow pattern of “Change → Distribute → Block”. This pattern is consistently applied across all core infrastructure elements (Traffic, Power, and Cooling). Let’s examine each stage and its applications:

1. Change Stage

  • Transforms incoming resources into forms suitable for the system
  • Traffic: Protocol/bandwidth conversion through routers
  • Power: Voltage/current conversion through transformers/UPS
  • Cooling: Temperature conversion through chillers/heat exchangers

2. Distribute Stage

  • Efficiently distributes converted resources where needed
  • Traffic: Network load distribution through switches and load balancers
  • Power: Power distribution through distribution boards and bus ducts
  • Cooling: Cooling air/water distribution through ducts/piping/dampers

3. Block Stage

  • Ensures system protection and security
  • Traffic: Security threat prevention through firewalls/IPS/IDS
  • Power: Overload protection through circuit breakers and fuses
  • Cooling: Backflow prevention through shutoff valves and dampers

Benefits of this unified approach:

  1. Ensures consistency in system design
  2. Increases operational management efficiency
  3. Enables quick problem identification
  4. Improves scalability and maintenance

Detailed breakdown by domain:

Traffic Management

  • Change: Router gateways (Protocol/Bandwidth)
  • Distribute: Switch/L2/L3, Load Balancer
  • Block: Firewall, IPS/IDS, ACL Switch

Power Management

  • Change: Transformer, UPS (Voltage/Current/AC-DC)
  • Distribute: Distribution boards/bus ducts
  • Block: Circuit breakers (MCCB/ACB), ELB, Fuses

Cooling Management

  • Change: Chillers/Heat exchangers (Water→Air)
  • Distribute: Ducts/Piping/Dampers
  • Block: Backflow prevention/isolation/fire dampers, shutoff valves

This structure enables systematic and efficient operation of complex data center infrastructure by managing the three critical supply elements (Traffic, Power, Cooling) within the same framework. Each component plays a specific role in ensuring the reliable and secure operation of the data center, while maintaining consistency across different systems.

Data Center Pipeline

With a Claude
Detailed analysis of the Data Center Pipeline diagram:

  1. Traffic Pipeline
  • Bidirectional network traffic handling
  • Infrastructure flow: Router → Switch → LAN
  • Responsible for stable data transmission and reception
  1. Power Pipeline
  • Power consumption converted to heat
  • Flow: Substation → Transformer → UPS/Battery → PDU (Power Distribution Unit)
  • Ensures stable power supply and backup systems
  1. Water (Cooling) Pipeline
  • Circulation cooling system through temperature change
  • Flow: Water Pump → Cooling Tower → Chiller → CRAC/CRAH (Computer Room Air Conditioning/Handler)
  • Efficiently controls server heat generation
  1. Data Center Management Functions
  • Processing: Data and system processing
  • Transmission: Data transfer
  • Distribution: Resource allocation
  • Cutoff: System protection during emergencies

Comprehensive Summary: This diagram illustrates the core infrastructure of a modern data center. It shows the seamless integration of three critical pipelines: network traffic for data processing, power supply for system operation, and cooling systems for equipment protection. Each pipeline undergoes multiple processing stages, working harmoniously to ensure stable data center operations. The four core management functions – processing, transmission, distribution, and cutoff – guarantee the efficiency and stability of the entire system. This integrated infrastructure design enables reliable operation of data centers, which form the foundation of modern digital services. The careful balance between these systems is crucial for maintaining optimal performance, ensuring business continuity, and protecting valuable computing resources. The design demonstrates how modern data centers handle the complex requirements of digital infrastructure while maintaining reliability and efficiency. 

Server Room Metric Correlation

With Claude
Server Room Metric Correlation Analysis & Operations Guide

1. Diagram Structure Analysis

Key Component Areas

  1. Server Zone (Left)
  • Server racks and equipment
  • Workload-driven CPU/GPU operations
  • Load metrics indicating rising system demands
  • Resource utilization monitoring
  1. Power Supply Zone (Center Bottom)
  • Power metering system
  • Power consumption monitoring
  • Load status tracking with increasing indicators
  1. Hot Zone (Center)
  • Heat generation and thermal management area
  • Exhaust temperature monitoring
  • Return temperature tracking
  • Overall temperature management
  1. Cool Zone (Right)
  • Cooling system operations
  • Inlet temperature control
  • Cooling supply temperature management
  • Cooling system load monitoring

2. Core Metric Correlations

Basic Metric Flow

  1. Load Generation
  • Server workload increases
  • CPU/GPU utilization rises
  • System load elevation
  1. Power Consumption
  • Load-driven power usage increase
  • Power efficiency monitoring
  • Overall system load tracking
  1. Thermal Management
  • Heat generation in Hot Zone
  • Exhaust/Return temperature differential
  • Cooling system response
  1. Cooling Efficiency
  • Cool Zone temperature regulation
  • Cooling system load adjustment
  • System stability maintenance

3. Key Operational Indicators

Primary Metrics

  1. Performance Metrics
  • Server workload levels
  • CPU/GPU utilization
  • System response metrics
  1. Environmental Metrics
  • Zone temperatures
  • Air flow patterns
  • Cooling efficiency
  1. Power Metrics
  • Power consumption rates
  • Load distribution
  • Efficiency indicators

4. Monitoring Focus Points

Critical Correlations

  1. Load-Power-Temperature Relationship
  • Workload impact on power consumption
  • Heat generation patterns
  • Cooling system response efficiency
  1. System Stability Indicators
  • Temperature zone balance
  • Power distribution effectiveness
  • Cooling system performance

This comprehensive analysis of server room metrics and their correlations enables effective monitoring and management of the entire system, ensuring optimal performance and stability through understanding the interconnected nature of all components and their respective metrics.

The diagram effectively illustrates how different metrics interact and influence each other, providing a clear framework for monitoring and maintaining server room operations efficiently.

High Computing Room Requires

With a Claude’s Help
Core Challenge:

  1. High Variability in GPU/HPC Computing Room
  • Dramatic fluctuations in computing loads
  • Significant variations in power consumption
  • Changing cooling requirements

Solution Approach:

  1. Establishing New Data Collection Systems
  • High Resolution Data: More granular, time-based data collection
  • New Types of Data Acquisition
  • Identification of previously overlooked data points
  1. New Correlation Analysis
  • Understanding interactions between computing/power/cooling
  • Discovering hidden patterns among variables
  • Deriving predictable correlations

Objectives:

  • Managing variability through AI-based analysis
  • Enhancing system stability
  • Improving overall facility operational efficiency

In essence, the diagram emphasizes that to address the high variability challenges in GPU/HPC environments, the key strategy is to collect more precise and new types of data, which enables the discovery of new correlations, ultimately leading to improved stability and efficiency.

This approach specifically targets the inherent variability of GPU/HPC computing rooms by focusing on data collection and analysis as the primary means to achieve better operational outcomes.