Data Center Challenges

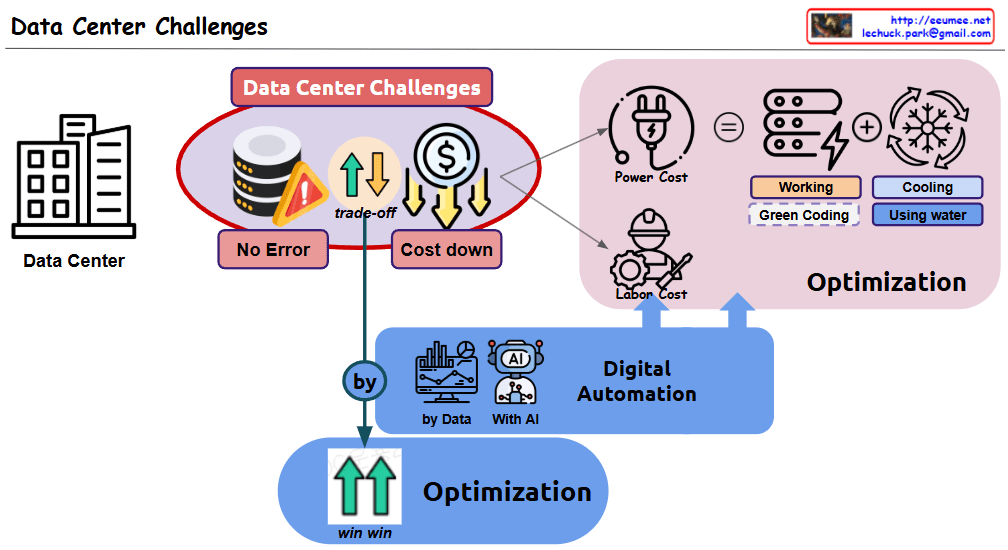
This diagram illustrates “Data Center Challenges” by visually explaining the key challenges faced by data centers and their potential solutions.

The central red circle highlights the main challenges:

  • “No Error” – representing reliable operations
  • “Cost down” – representing economic efficiency
  • Between these two goals, there typically exists a “trade-off” relationship

The “Optimization” section on the right breaks down the cost structure:

  1. “Power Cost”:
    • “Working” – representing IT power that can be optimized through “Green Coding”
    • “Cooling” – can be significantly optimized with “Using water” (liquid cooling) technologies
  2. “Labor Cost”:
    • Personnel costs that can be reduced through automation

The middle “Digital Automation” section shows:

  • “by Data” decision-making approaches
  • “With AI” methodologies

At the bottom, the final outcome shows:

  • “win win” – upward arrows and “Optimization” indicating that both goals can be achieved simultaneously

This diagram demonstrates how digital automation leveraging data and AI can help data centers achieve the seemingly conflicting goals of reliable operations and cost reduction simultaneously.

With Claude

Data Center NOW

This image shows a data center architecture diagram titled “Data Center Now” at the top. It illustrates the key components and flow of a modern data center infrastructure.

The diagram depicts:

  1. On the left side: An “Explosion of data” icon with data storage symbols, pointing to computing components with the note “More Computing is required”
  2. In the center: Server racks connected to various systems with colored lines indicating different connections (red, blue, green)
  3. On the right side: Several technology components illustrated with circular icons and labels:
    • “Software Defined” with a computer/gear icon
    • “AI & GPU” with neural network and GPU icons and note “Big power is required”
    • “Renewable Energy & Grid Power” with solar panel and wind turbine icons
    • “Optimized Cooling /w Using Water” with cooling system icon
    • “Enhanced Op System & AI Agent” with a robotic/AI system icon

The diagram shows how data flows through processing units and connects to different infrastructure elements, emphasizing modern data center requirements like increased computing power, AI capabilities, power management, and cooling solutions.

With Claude

Power Usage of Cooling

Data Center Cooling System Power Usage Analysis

This diagram illustrates the cooling system configuration of a data center and the power consumption proportions of each component.

Cooling Facility Stages:

  1. Cooling Tower: The first stage, generating Cooling Water through contact between outside air and water.
  2. Chiller: Receives cooling water and converts it to Chilled Water at a lower temperature through the compressor.
  3. CRAH (Computer Room Air Handler): Uses chilled water to produce Cooling Air for the server room.
  4. Server Rack Cooling: Finally, cooling air reaches the server racks and absorbs heat.

Several auxiliary devices operate in this process:

  • Pump: Regulates the pressure and speed of cooling water and chilled water.
  • Header: Efficiently distributes and collects water.
  • Heat Exchanger: Optimizes the heat transfer process.
  • Fan: Circulates cooling air.

Cooling Facility Power Usage Proportions:

  • Chiller/Compressor: The largest power consumer, accounting for 60-80% of total cooling power.
  • Pump: Consumes 10-15% of power.
  • Cooling Tower: Uses approximately 10% of power.
  • CRAH/Fan: Uses approximately 10% of power.
  • Other components: Account for the remaining 10%.

Purpose of Energy Usage (Efficiency):

  • As indicated in the blue box on the lower right, “Most of the power is to lower the temperature and transfer it.”
  • The system operates through Supply and Return loops to remove heat from the “Sources of heat.”
  • The note “100% Free Cooling = Chiller Not working” indicates that when using natural cooling methods, the most power-intensive component (the chiller) doesn’t need to operate, potentially resulting in significant energy efficiency improvements.

This data center cooling system diagram illustrates how cooling moves from Cooling Tower to Chiller to CRAH to server racks, with compressors consuming the majority (60-80%) of power usage, followed by pumps (10-15%) and other components (10% each). The system primarily functions to lower temperatures and transfer heat, with the important insight that 100% free cooling eliminates the need for chillers, potentially saving significant energy.

With Claude

CFD + AI/ML for Digital Twin 2

Digital Twin System Using CFD and AI/ML

This diagram illustrates the complete lifecycle of a digital twin system, showing how CFD (Computational Fluid Dynamics) and AI/ML play crucial roles at different stages.

Key Stages

  1. Design:
    • CFD plays a critical role at this stage
    • Establishes the foundation through geometric modeling, physical property definition, and boundary condition setup
    • Accurate physical simulation at this stage forms the basis for future predictions
  2. Build:
    • Implementation stage for the designed model
    • Integration of both CFD models and AI/ML models
  3. Operate:
    • AI/ML plays a critical role at this stage
    • System performance prediction and optimization based on real-time data
    • Continuous model improvement by learning from operational data

Technology Integration Process

  • CFD Track:
    • Provides accurate physical modeling during the design phase
    • Defines geometry, physics, and boundary conditions to establish the basic structure
    • Verifies model accuracy through validation processes
    • Updates the model according to changes during operation
  • AI/ML Track:
    • Configures learning data and defines metrics
    • Sets up data lists and resolution
    • Provides predictive models using real-time data during the operation phase
    • Continuously improves prediction accuracy by learning from operational data

Cyclical Improvement System

The key to this system is that physical modeling (CFD) at the design stage and data-driven prediction (AI/ML) at the operation stage work complementarily to form a continuous improvement cycle. Real data collected during operation is used to update the AI/ML models, which in turn contributes to improving the accuracy of the CFD models.

With Claude

Power Flow

Power Flow Diagram Analysis

This image illustrates a power flow diagram for a data center or server room, showing the sequential path of electricity from external power sources to the final server equipment.

Main Components:

  1. Intake: External power supply at 154 kV / 22.9 kV with 100MW(MVA) capacity
  2. Transformer: Performs voltage conversion (step down) to make power easier to handle
  3. Generator: Provides backup power during outages, connected to a fuel tank
  4. Transformer #2: Second voltage conversion, bringing power closer to usable voltage (220/380V)
  5. UPS/Battery: Uninterruptible Power Supply with battery backup for blackout protection, showing capacity (KVA) and backup time
  6. PDU/TOB: Power Distribution Unit for connecting to servers
  7. Server: Final power consumption equipment

Key Features:

  • Red circles indicate power switching/distribution points
  • Dotted lines show backup power connections
  • The bottom section details the characteristics of each component:
    • Intake power specifications
    • Voltage conversion information
    • Blackout readiness status
    • Server connection details
    • Power usage status

Summary:

This diagram represents the complete power infrastructure of a data center, illustrating how electricity flows from the grid through multiple transformation and backup systems before reaching the servers. It demonstrates the redundancy measures implemented to ensure continuous operation during power outages, including generators and UPS systems. The power path includes necessary voltage step-down transformations to convert high-voltage grid power to server-appropriate voltages, with switching and distribution points throughout the system. This comprehensive power flow design ensures reliable, uninterrupted power delivery critical for data center operations.

With Claude

Cooling Works & Metrics

Data Center Cooling System Overview

Cooling System Operation Flow

  1. Cooling Tower: Produces cooling water by releasing heat to the outside environment. This stage involves dissipating heat into the atmosphere.
  2. Chiller: Absorbs heat from the cooling water to produce chilled water. The condenser plays a crucial role in this process.
  3. Air Handling Unit: Uses chilled water to cool air, creating cooling air for the server room.
  4. Server Room: The cooled air is ultimately supplied to the server room to remove heat from IT equipment.

Key Control and Conversion Equipment

  • Pump: Regulates the pressure and speed of cooling and chilled water to maintain appropriate flow rates throughout the system.
  • Header: Handles the distribution and collection of cooling and chilled water, ensuring uniform distribution across the system.
  • Heat Exchanger/Condenser: Performs heat exchange processes at various stages, with the condenser playing a particularly important role in the chiller.
  • Fan: Circulates cooling air to the server room.

Core Measurement Metrics

  • Temperature: Monitors the temperature of cooling water, chilled water, and air at each stage to evaluate system efficiency.
  • Water Flow Rate: Measures the amount of cooling and chilled water circulating in the system to ensure adequate cooling capacity.
  • Supply/Return Temperature Differential: Measures the temperature difference before and after passing through each component to assess heat exchange efficiency.
  • Power Usage: Monitors the power consumption of pumps, chillers, fans, and other equipment to manage energy efficiency.

These metrics are monitored in detail by pump and condenser to optimize the overall performance of the cooling system and improve energy efficiency.

With Claude

Operation with system

Key Analysis of Operation Cost Diagram

This diagram illustrates the cost structure of system implementation and operation, highlighting the following key concepts:

  1. High Initial Deployment Cost: At the beginning of a system’s lifecycle, deployment costs are substantial. This represents a one-time investment but requires significant capital.
  2. Perpetual Nature of Operation Costs: Operation costs continue indefinitely as long as the system exists, making them a permanent expense factor.
  3. Components of Operation Cost: Operation costs consist of several key elements:
    • Energy Cost
    • Labor Cost
    • Disability Cost
    • Additional miscellaneous costs (+@)
  4. Role of Automation Systems: As shown on the right side of the diagram, implementing automation systems can significantly reduce operation costs over time.
  5. Timing of Automation Investment: While automation systems also require initial investment during the early phases, they deliver long-term operation cost reduction benefits, ultimately improving the overall cost structure.

This diagram effectively visualizes the relationship between initial costs and long-term operational expenses, as well as the cost optimization strategy through automation.

With Claude