DC Cooling (R)

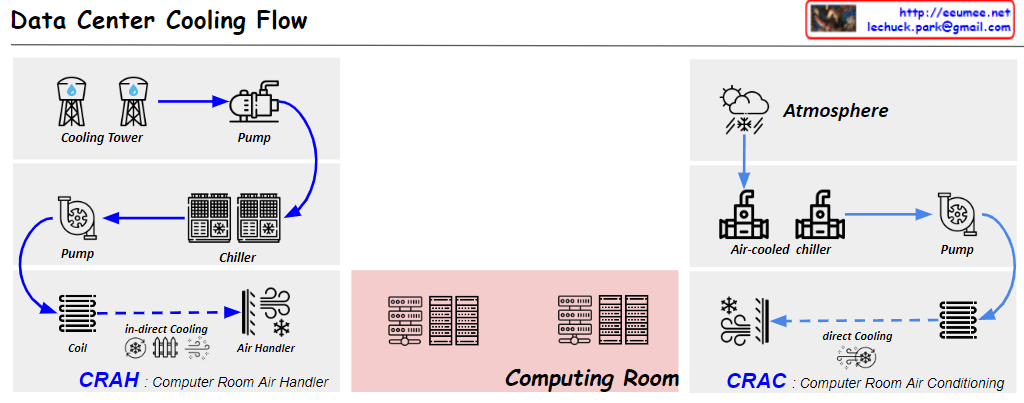
Data Center Cooling System Core Structure

This diagram illustrates an integrated data center cooling system centered on chilled water/cooling water circulation and heat exchange.

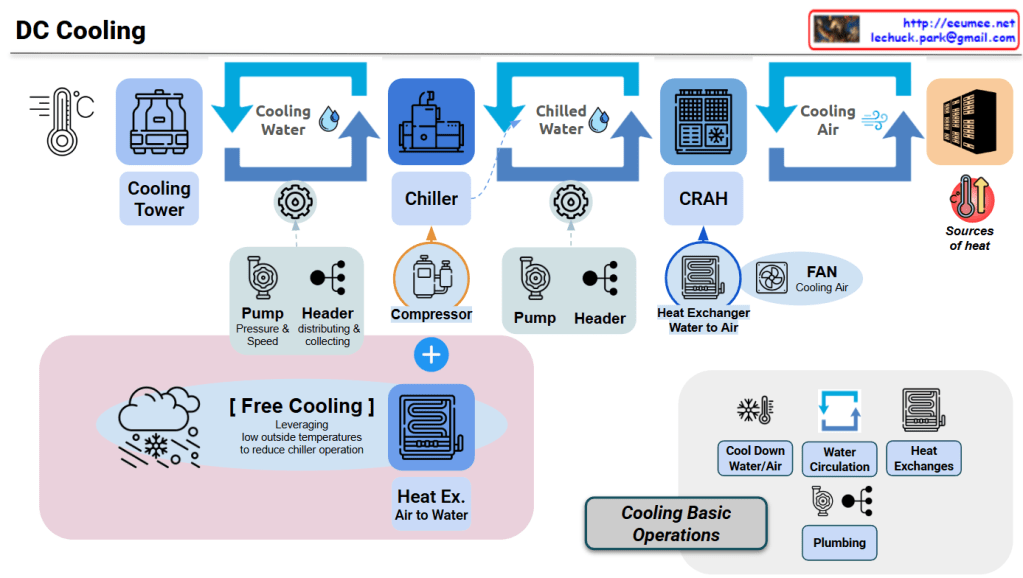
Core Cooling Circulation Structure

Primary Loop: Cooling Water Loop

Cooling Tower → Cooling Water → Chiller → (Heat Exchange) → Cooling Tower

  • Cooling Tower: Dissipates heat from cooling water to atmosphere using outdoor air
  • Pump/Header: Controls cooling water pressure and flow rate through circulation pipes
  • Heat Exchange in Chiller: Cooling water exchanges heat with refrigerant to cool the refrigerant

Secondary Loop: Chilled Water Loop

Chiller → Chilled Water → CRAH → (Heat Exchange) → Chiller

  • Chiller: Generates chilled water (7-12°C) through compressor and refrigerant cycle
  • Pump/Header: Circulates chilled water to CRAH units and returns it back
  • Heat Exchange in CRAH: Chilled water exchanges heat with air to cool the air

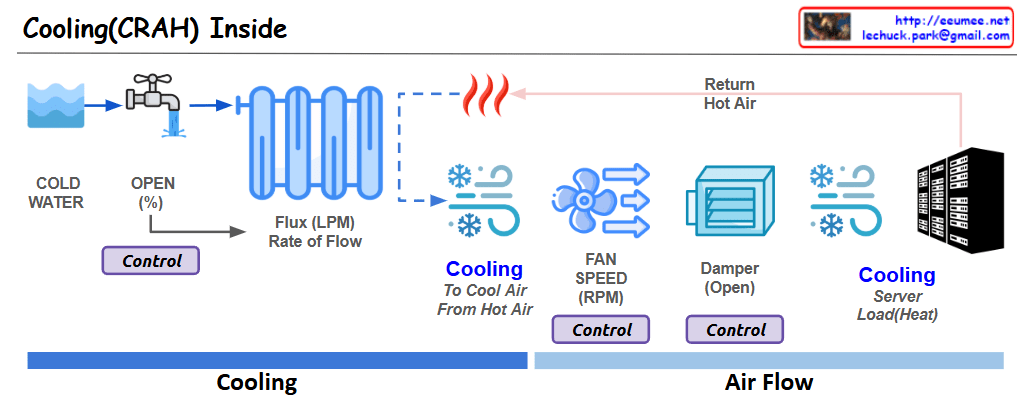
Tertiary Loop: Cooling Air Loop

CRAH → Cooling Air → Servers → Hot Air → CRAH

  • CRAH (Computer Room Air Handler): Generates cooling air through water-to-air heat exchanger
  • FAN: Forces circulation of cooling air throughout server room
  • Heat Absorption: Air absorbs server heat and returns to CRAH

Heat Exchange Critical Points

Heat Exchange #1: Inside Chiller

  • Cooling Water ↔ Refrigerant: Transfers refrigerant heat to cooling water in condenser
  • Refrigerant ↔ Chilled Water: Absorbs heat from chilled water to refrigerant in evaporator

Heat Exchange #2: CRAH

  • Chilled Water ↔ Air: Transfers air heat to chilled water in water-to-air heat exchanger
  • Chilled water temperature rises → Returns to chiller

Heat Exchange #3: Server Room

  • Hot Air ↔ Servers: Air absorbs heat from servers
  • Temperature-increased air → Returns to CRAH

Energy Efficiency: Free Cooling

Low-Temperature Outdoor Air → Air-to-Water Heat Exchanger → Chilled Water Cooling → Reduced Chiller Load

  • Condition: When outdoor temperature is sufficiently low
  • Effect: Reduces chiller operation and compressor power consumption (up to 30-50%)
  • Method: Utilizes natural cooling through cooling tower or dedicated heat exchanger

Cooling System Control Elements

Cooling Basic Operations Components:

  • Cool Down: Controls water/air temperature reduction
  • Water Circulation: Adjusts flow rate through pump speed/pressure control
  • Heat Exchanges: Optimizes heat exchanger efficiency
  • Plumbing: Manages circulation paths and pressure loss

Heat Flow Summary

Server Heat → Air → CRAH (Heat Exchange) → Chilled Water → Chiller (Heat Exchange) → 
Cooling Water → Cooling Tower → Atmospheric Discharge


Summary

This system efficiently removes server heat to the outdoor atmosphere through three cascading circulation loops (air → chilled water → cooling water) and three strategic heat exchange points (CRAH, Chiller, Cooling Tower). Free cooling optimization reduces energy consumption by up to 50% when outdoor conditions permit. The integrated pump/header network ensures precise flow control across all loops for maximum cooling efficiency.


#DataCenterCooling #ChilledWater #CRAH #FreeCooling #HeatExchange #CoolingTower #ThermalManagement #DataCenterInfrastructure #EnergyEfficiency #HVACSystem #CoolingLoop #WaterCirculation #ServerCooling #DataCenterDesign #GreenDataCenter

With Claude

Cooling Works & Metrics

Data Center Cooling System Overview

Cooling System Operation Flow

  1. Cooling Tower: Produces cooling water by releasing heat to the outside environment. This stage involves dissipating heat into the atmosphere.
  2. Chiller: Absorbs heat from the cooling water to produce chilled water. The condenser plays a crucial role in this process.
  3. Air Handling Unit: Uses chilled water to cool air, creating cooling air for the server room.
  4. Server Room: The cooled air is ultimately supplied to the server room to remove heat from IT equipment.

Key Control and Conversion Equipment

  • Pump: Regulates the pressure and speed of cooling and chilled water to maintain appropriate flow rates throughout the system.
  • Header: Handles the distribution and collection of cooling and chilled water, ensuring uniform distribution across the system.
  • Heat Exchanger/Condenser: Performs heat exchange processes at various stages, with the condenser playing a particularly important role in the chiller.
  • Fan: Circulates cooling air to the server room.

Core Measurement Metrics

  • Temperature: Monitors the temperature of cooling water, chilled water, and air at each stage to evaluate system efficiency.
  • Water Flow Rate: Measures the amount of cooling and chilled water circulating in the system to ensure adequate cooling capacity.
  • Supply/Return Temperature Differential: Measures the temperature difference before and after passing through each component to assess heat exchange efficiency.
  • Power Usage: Monitors the power consumption of pumps, chillers, fans, and other equipment to manage energy efficiency.

These metrics are monitored in detail by pump and condenser to optimize the overall performance of the cooling system and improve energy efficiency.

With Claude

Server Room Cooling Metrics

This dashboard is designed to monitor the comprehensive performance of server room cooling systems by displaying temperature changes alongside server power consumption data, while also tracking water flow rate (Water LPM) and fan speed. The main utilities and applications of this approach include:

  1. Integrated Data Visualization:
    • Enables simultaneous monitoring of temperature, power consumption, and cooling system parameters (flow rate, fan speed) in a single dashboard, facilitating the identification of correlations between systems.
    • Allows operators to immediately observe how increases in power consumption lead to temperature rises and the subsequent response of cooling systems.
  2. Benefits of Heat Map Implementation:
    • Represents data from multiple temperature sensors categorized as MAX/MIN/AVG with color differentiation, providing intuitive understanding of spatial temperature distribution.
    • Creates clear visual contrast between yellow (HOTZONE) and blue (COOLZONE) areas, making temperature gradients easily recognizable.
    • Enables quick identification of temperature anomalies for early detection of potential issues.
  3. Cooling Efficiency Monitoring:
    • Facilitates analysis of the relationship between Water LPM (water flow rate) and temperature changes to evaluate cooling water usage efficiency.
    • Allows assessment of air circulation system effectiveness by examining correlations between fan speed and COOLZONE/HOTZONE temperature changes.
    • Enables real-time monitoring of heat exchange efficiency through the difference between RETURN TEMP and SUPPLY TEMP.
  4. Event Detection and Analysis:
    • Features an “EVENT(Big Change?)” indicator that helps quickly identify significant changes or anomalies.
    • Displays data from the past 30 minutes in 5-minute intervals, enabling analysis of short-term trends and patterns.
  5. Operational Decision Support:
    • Provides immediate feedback on the effects of cooling system adjustments (changes in flow rate or fan speed) on temperature, enabling optimization of operational parameters.
    • Helps evaluate the response capability of cooling systems during increased server loads, supporting capacity planning.
    • Offers necessary data to balance energy efficiency with server stability.

This dashboard goes beyond a simple monitoring tool to serve as a comprehensive decision support system for optimizing thermal management in server rooms, improving energy efficiency, and ensuring equipment stability. The heat map visualization approach, in particular, makes complex temperature data intuitively interpretable, allowing operators to quickly assess situations and respond appropriately.

With Claude

Cooling(CRAH) Inside

This image shows a diagram of the cooling system structure inside a CRAH (Computer Room Air Handler).

  1. Cooling Process Flow:
  • COLD WATER enters the system
  • Flow is controlled through an OPEN valve (%)
  • Water flows at a specified Flux rate (LPM)
  • Passes through a heat exchanger (coil)
  1. Air Circulation:
  • Return Hot Air from servers enters the system
  • Air is cooled through the heat exchanger
  • Air is circulated by fans (FAN SPEED in RPM)
  • Air volume is controlled by a Damper (Open)
  • Cooled air is supplied to the servers
  1. Key Control Elements:
  • Valve opening percentage (%)
  • Fan speed (RPM)
  • Damper position (Open)

This system illustrates the basic operating principles of a cooling system used in data centers or server rooms to effectively control server heat generation. The main purpose is to maintain appropriate temperatures by continuously removing heat (Load/Heat) generated by the servers.

The diagram efficiently shows the complete cycle from cold water intake to the cooling of hot server air and its recirculation, demonstrating how CRAH systems maintain optimal operating temperatures in data center environments.

With Claude