Kernel Transport Layer Security

From Claude with some prompting
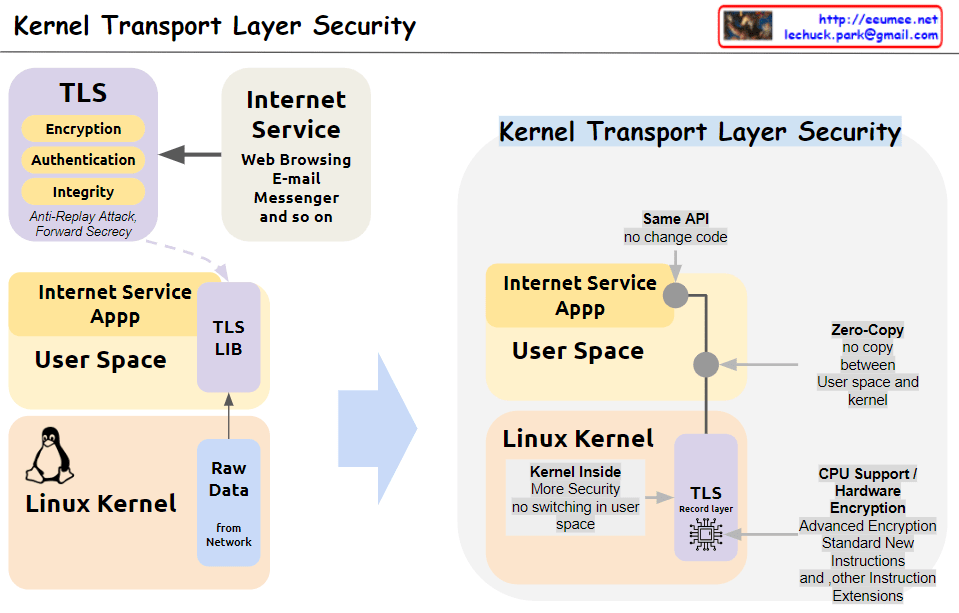
This image illustrates the concept and structure of KTLS (Kernel Transport Layer Security). KTLS implements the TLS protocol within the Linux kernel to improve performance and security.

  1. The core functionalities of TLS (encryption, authentication, integrity, anti-replay attack, and forward secrecy) are handled within the kernel.
  2. Applications for internet services (web browsing, email, messenger, etc.) run in user space and utilize the TLS functionality through the TLS library, while still using the same socket API.
  3. Data copying (Zero-Copy) between user space and kernel space is minimized, enhancing performance.
  4. With the TLS Record Layer operating inside the kernel, context switching to user space is reduced, improving security.
  5. Cryptographic acceleration features of CPUs, such as AES-NI and other encryption instruction extensions, are utilized to boost encryption operation performance.

In summary, by moving TLS processing to the kernel level, KTLS significantly improves both performance and security simultaneously.

01 world

From Claude with some prompting
This image depicts the evolution of how humans perceive and express the world around them.

It starts with the binary system of 0 and 1, from which letters and numbers were created, leading to the creation of the digital world represented by “01 Aa”.

Humans take in data from the world through various channels such as sight, sound, and touch in a comprehensive manner. This received data is then distinguished and perceived as 0 and 1, A and B, and so on.

With the advancement of computing technology and AI, tools like CPUs and neural networks enabled a deeper understanding of the world from both microscopic and macroscopic perspectives.

The images of the Earth and the universe symbolize the entirety of the world that humans perceive.

Therefore, this image illustrates the evolution of human perception, starting from the binary system, progressing through the comprehensive intake of data from various channels, and culminating in the development of computing and AI technologies.

TCP BBR

From ChatGPT with some prompting
Overview of TCP BBR:

  • TCP BBR optimizes network performance using Bottleneck Bandwidth and Round-trip time (RTT).
  • Speed is determined by RTT.
  • Bandwidth is determined by Bottleneck Bandwidth.

Learning Process:

  • Every ACK:
    • Updates the bottleneck bandwidth.
    • Tracks the minimum observed RTT value.
  • Every RTT:
    • Adjusts the sending size (n * MSS) and the pacing rate (the rate at which data is sent).

Sending Size Update:

  • BBR continuously updates the sending size (how many MSS to send) based on the current network conditions.

In summary, TCP BBR learns the network conditions by monitoring the bottleneck bandwidth and RTT, and accordingly adjusts the sending size and pacing rate to optimize data transmission, reducing congestion and improving performance.

Leetcode 974.Subarray Sums Divisible by K

From Claude with some prompting
Find Subarrays with Same Remainder First, we calculate the prefix sum, which is the cumulative sum up to each element in the array. For example, the prefix sum for [4, 5, 0, -2, -3, 1] is [4, 9, 9, 7, 4, 5]. Then, we find the remainder when each prefix sum is divided by k. In this case, with k=5, the remainders are [4, 4, 4, 2, 4, 0].

Count Subarrays with Same Remainder We count the number of subarrays that have the same remainder. For instance, if the remainder 4 appears 3 times, it means there are 3 subarrays ending with a sum divisible by 5 and leaving a remainder of 4. We store these counts in a remainder_count array.

Calculate Answer For the remainder 0, we assume there is always at least one subarray (the empty subarray), so we initialize remainder_count[0] = 1. Then, we calculate the combinations of subarrays with the same remainder. If there are remainder_count[r] subarrays with the same remainder r, the number of combinations is (remainder_count[r] * (remainder_count[r] – 1)) / 2. We sum up these values for all remainders to get the final answer.

In summary, this algorithm utilizes the remainders of prefix sums to count the number of subarrays with the same remainder, and then combines these counts to find the total number of subarrays whose sum is divisible by k.

Who First

From ChatGPT with some prompting
This image explores two potential scenarios related to the advancement of AI (Artificial Intelligence). It raises two main questions:

  1. Exponential Use of Data and Energy: The left side illustrates a scenario where data and energy created by humans are used exponentially by AI. This leads to the concern that data and energy might be depleted. It questions whether we will run out of data and energy first due to this exponential use.
  2. AI’s Self-Sufficiency: The right side presents the possibility that AI might be able to create new data and energy on its own. If AI can generate its own data and energy resources, it could overcome the problem of depletion.

Therefore, the image highlights a dilemma: on one hand, the rapid use of data and energy by AI might lead to their depletion, while on the other hand, AI might potentially find ways to create new data and energy to sustain itself. It questions which of these scenarios will happen first.

Trend & Prediction

From Claude with some prompting
The image presents a “Trend & Predictions” process, illustrating a data-driven prediction system. The key aspect is the transition from manual validation to automation.

  1. Data Collection & Storage: Digital data is gathered from various sources and stored in a database.
  2. Manual Selection & Validation: a. User manually selects which metric (data) to use b. User manually chooses which AI model to apply c. Analysis & Confirmation using selected data and model
  3. Transition to Automation:
    • Once optimal metrics and models are confirmed in the manual validation phase, the system learns and switches to automation mode. a. Automatically collects and processes data based on selected metrics b. Automatically applies validated models c. Applies pre-set thresholds to prediction results d. Automatically detects and alerts on significant predictive patterns or anomalies based on thresholds

The core of this process is combining user expertise with system efficiency. Initially, users directly select metrics and models, validating results to “educate” the system. This phase determines which data is meaningful and which models are accurate.

Once this “learning” stage is complete, the system transitions to automation mode. It now automatically collects, processes data, and generates predictions using user-validated metrics and models. Furthermore, it applies preset thresholds to automatically detect significant trend changes or anomalies.

This enables the system to continuously monitor trends, providing alerts to users whenever important changes are detected. This allows users to respond quickly, enhancing both the accuracy of predictions and the efficiency of the system.