From Claude with some prompting
WEB(Front) Layer
- Primary Components:
- Static Data: HTML, CSS, JavaScript files
- Storage: Browser-based storage solutions
- Performance Optimization:
- CDN: Global content delivery
- Caching: Response time improvement
- Enhanced Custom Experience:
- Optimized user interface
- Client-side performance enhancements
- WAS(Back) Layer
- Core Functions:
- Program Code: Server-side application logic
- Computing: Business process handling
- Development Features:
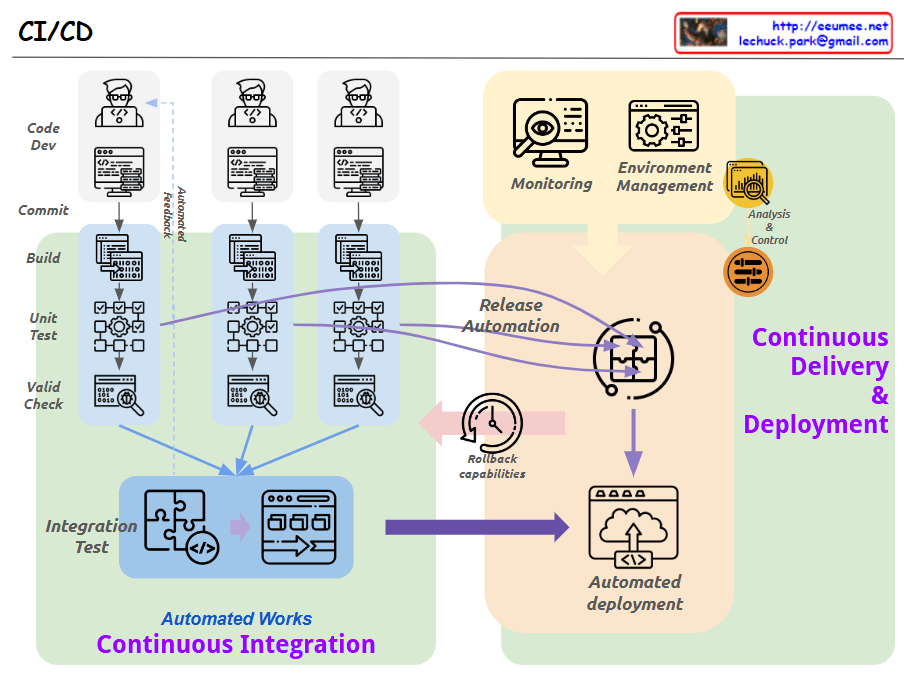
- Enhanced Development Environment (CI/CD):
- Continuous Integration for automated testing
- Continuous Deployment for automated delivery
- Automated build and release processes
- Development workflow optimization
- Biz Logic: Business rules implementation
- Microservices: Modular service architecture
- Enhanced Development Environment (CI/CD):
- DB Layer
- Data Management:
- Dynamic Data: Real-time data processing
- Variable(Memory): Memory-based data handling
- Business Data:
- Biz Data Scheme & ACID:
- Data structure and relationships
- Transaction integrity
- Data consistency
- RDBMS/NoSQL: Flexible database solutions
- Biz Data Scheme & ACID:
- Infrastructure Characteristics
- High Availability (Biz Continues):
- Uninterrupted service operation
- Fault tolerance
- Business continuity
- Scalability (Biz Changes):
- System expansion capability
- Business growth support
- Flexible architecture
- Key Integration Points
- WEB ↔ WAS: Static data and program code interaction
- WAS ↔ DB: Dynamic data and business logic connection
- Biz Logic ↔ Biz Data: Direct business data operations
This architecture demonstrates a modern, well-structured web service that emphasizes:
Robust business logic handling
Efficient data management
Clear separation of concerns
Automated development processes
Scalable infrastructure
High availability
Enhanced user experience