From Claude with some prompting
the AI-based enterprise document analysis/conversation service architecture:
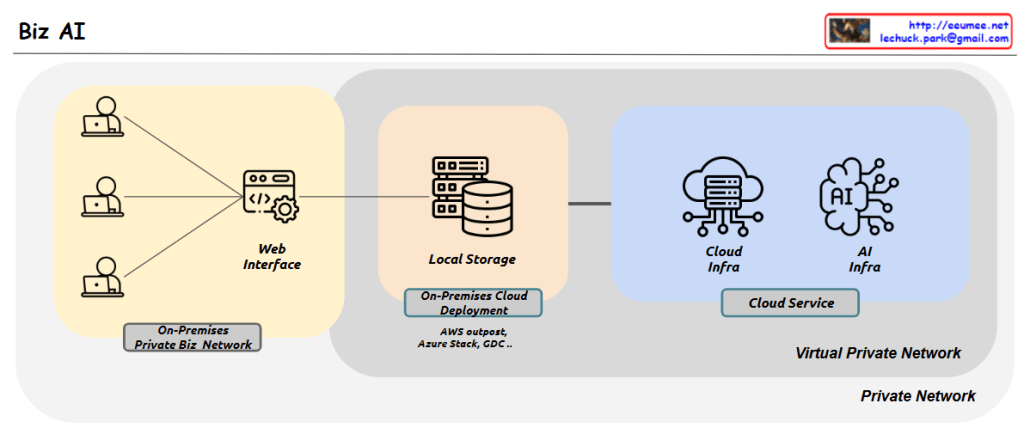
Architectural Components:
- User Access Layer (On-Premises Private Biz Network)
- User access through web interface
- Secure access within corporate internal network environment
- Data Management Layer (Local Storage)
- On-Premises Cloud Deployment support
- Hybrid cloud environment with AWS outpost, Azure Stack, GCP
- Secure storage of corporate documents and data
- Service Operation Layer (Cloud/AI Infra)
- Enhanced security through Virtual Private Network
- Cloud-based AI service integration
- Document-based AI services like NotebookLM
Key Features and Benefits:
- Security
- Private Network-based operation
- Minimized data leakage risk
- Regulatory compliance facilitation
- Scalability
- Hybrid cloud architecture
- Efficient resource management
- Expandable to various AI services
- Operational Efficiency
- Centralized data management
- Unified security policy implementation
- Easy monitoring and management
Considerations and Improvements:
- System Optimization
- Balance between performance and cost
- Implementation of caching system
- Establishment of monitoring framework
- Future Extensibility
- Integration potential for various AI services
- Multi-cloud strategy development
- Resource adjustment based on usage patterns
Technical Considerations:
- Performance Management
- Network bandwidth and latency optimization
- AI model inference response time management
- Data synchronization between local and cloud storage
- Security Measures
- Data governance and sovereignty
- Secure data transmission
- Access control and authentication
- Infrastructure Management
- Resource scaling strategy
- Service availability monitoring
- Disaster recovery planning
This architecture provides a framework for implementing document-based AI services securely and efficiently in enterprise environments. It is particularly suitable for organizations where data security and regulatory compliance are critical priorities. The design allows for gradual optimization based on actual usage patterns and performance requirements while maintaining a balance between security and functionality.
This solution effectively combines the benefits of on-premises security with cloud-based AI capabilities, making it an ideal choice for enterprises looking to implement advanced document analysis and conversation services while maintaining strict data control and compliance requirements.