In the future, organizations might hire AI agents instead of people, shifting focus from salaries to model usage fees, performance, and data quality. Choosing the right AI could require strong problem definition and benchmarking, along with infrastructure like data centers and computing power.
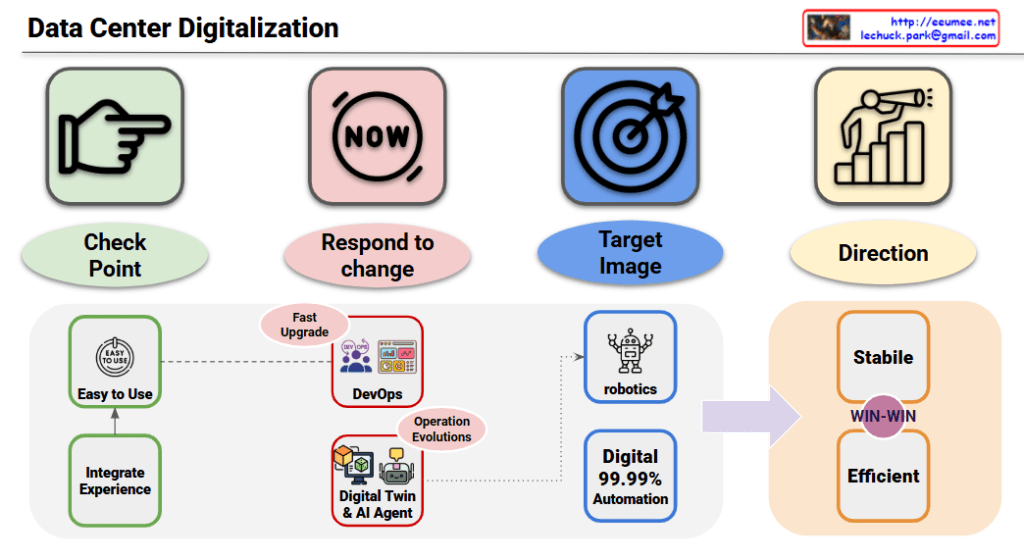
This image presents a roadmap for “Data Center Digitalization” showing the evolutionary process. Based on your explanation, here’s a more accurate interpretation:
Top 4 Core Concepts (Purpose for All Stages)
Check Point: Current state inspection and verification point for each stage
Respond to change: Rapid response system to quick changes
Target Image: Final target state to be achieved
Direction: Overall strategic direction setting
Digital Transformation Evolution Stages
Stage 1: Experience-Based Digital Environment Foundation
Easy to Use: Creating user-friendly digital environments through experience
Integrate Experience: Integrating existing data center operational experience and know-how into the digital environment
Purpose: Utilizing existing operational experience as checkpoints to establish a foundation for responding to changes
This diagram presents a strategic roadmap where data centers systematically integrate existing operational experience and know-how into digital environments, evolving step by step while reflecting the top 4 core concepts as purposes for each stage, ultimately achieving both stability and efficiency simultaneously.
This image visually explains various ways charts help in decision-making.
Here’s a breakdown of the key elements:
Left Side:
An icon representing a chart is shown. This signifies the role of charts in visually representing data.
Center:
Five main roles of charts in contributing to decision-making are listed:
Detecting Short-Term Anomalies (Problem Identification): Charts help in identifying short-term unusual patterns and pinpointing problems.
Analyzing Long-Term Trends (Future Planning & Identifying Savings Opportunities): Charts are used to understand long-term data tendencies, which aids in future planning and discovering cost-saving opportunities.
Comparing Against Baselines (Performance Measurement & Benchmarking): Charts are utilized to measure current performance against predefined baselines and for benchmarking purposes.
Identifying Savings Opportunities: Through chart analysis, areas or methods for cost reduction can be identified.
Communicating Insights Effectively (Stakeholder Reporting & Decision Making): Charts are valuable for visualizing complex data in an easy-to-understand manner, assisting in stakeholder reporting and supporting decision-making.
Right Side:
An icon depicting people connected by arrows is visible, with the text “Help for Decisions.” This indicates that all the roles of charts mentioned above ultimately aim to facilitate effective decision-making.
In summary, this image emphasizes that charts go beyond simple data visualization; they are essential tools for identifying problems, understanding trends, measuring performance, discovering opportunities, and ultimately leading to clear decision-making through data analysis.
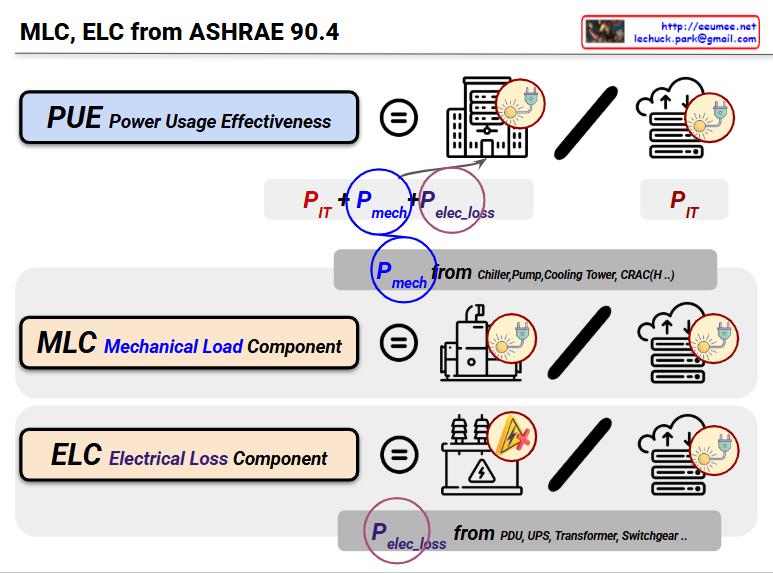
This image illustrates the concepts of PUE (Power Usage Effectiveness), MLC (Mechanical Load Component), and ELC (Electrical Loss Component) as defined in ASHRAE 90.4 standard.
Key Component Analysis:
1. PUE (Power Usage Effectiveness)
A metric measuring data center power usage efficiency
Formula: PUE = (P_IT + P_mech + P_elec_loss) / P_IT
Total power consumption divided by IT equipment power
2. MLC (Mechanical Load Component)
Ratio of mechanical load component to IT power
Formula: MLC = P_mech / P_IT
Represents how much power the cooling systems (chiller, pump, cooling tower, CRAC, etc.) consume relative to IT power
3. ELC (Electrical Loss Component)
Ratio of electrical loss component to IT power
Formula: ELC = P_elec_loss / P_IT
Represents how much power is lost in electrical infrastructure (PDU, UPS, transformer, switchgear, etc.) relative to IT power
Diagram Structure:
Each component is connected as follows:
Left: Component definition
Center: Equipment icons (cooling systems, power systems, etc.)
Right: IT equipment (server racks)
Necessity and Management Benefits:
These metrics are essential for optimizing power costs that constitute a significant portion of data center operating expenses, enabling identification of inefficient cooling and power system segments to reduce power costs and determine investment priorities.
This represents the ASHRAE standard methodology for systematically analyzing data center power efficiency and creating economic and environmental value through continuous improvement.
This updated image titled “Data?” presents a deeper philosophical perspective on data and AI.
Core Concept:
Human Perception is Limited
Compared to the infinite complexity of the real world, the scope that humans can perceive and define is constrained
The gray area labeled “Human perception is limited” visualizes this boundary of recognition
Two Dimensions of AI Application:
Deterministic Data
Data domains that humans have already defined and structured
Contains clear rules and patterns that AI can process in predictable ways
Represents traditional AI problem-solving approaches
Non-deterministic Data
Data from domains that humans haven’t fully defined
Raw data from the real world with high uncertainty and complexity
Areas where AI must discover and utilize patterns without prior human definitions
Key Insight: This diagram illustrates that AI’s true potential extends beyond simply solving pre-defined human problems. While AI can serve as a tool that opens new possibilities by transcending human cognitive boundaries and discovering complex patterns from the real world that we haven’t yet defined or understood, there remains a crucial human element in this process. Even as AI ventures into unexplored territories of reality beyond human-defined problem spaces, humans still play an essential role in determining how to interpret, validate, and responsibly apply these AI-discovered insights. The diagram suggests a collaborative relationship where AI expands our perceptual capabilities, but human judgment and decision-making remain fundamental in guiding how these expanded possibilities are understood and utilized.
This image shows a flowchart titled “Road to AI” that illustrates the step-by-step process of AI development.
Main Stages:
Digitization – Starting from a globe icon, data is converted into digital format (binary code)
Central Processing Area – Data is processed through network structures, where two key processes occur in parallel:
Verification – Confirming data accuracy
Tuning – Improving the model through “Higher Resolution” and “More Relative Data”
AI System – Finally implemented as an AI robot
Development Phases (Right Side):
“Easy First, Everybody Know” – Starting with simple tasks that everyone can understand
“Again & Again” – Iterative improvement process
“More Difficult & Auto Decision” – Advanced stage with complex and automated decision-making
This diagram visually represents how AI development progresses from simple data digitization, through continuous verification and tuning processes, and gradually evolves into sophisticated AI systems capable of complex automated decision-making. The process emphasizes the iterative nature of AI development, moving from basic, universally understood concepts to increasingly complex autonomous systems.