On-device AI

From DALL-E with some prompting
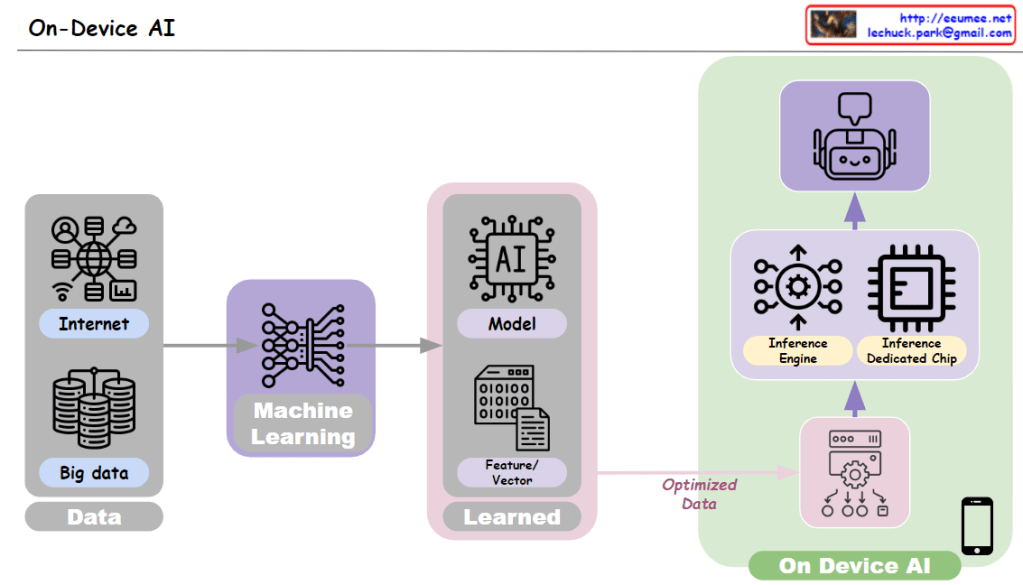
The image is a diagram explaining the concept of “On-Device AI,” which describes the process of operating artificial intelligence within a device. The stages are as follows:

Data: It begins with the collection of data from large databases and the internet, represented by a “Big data” icon and various icons representing different internet services.

Machine Learning: The collected data is used to train models through the machine learning process, depicted by a neural network icon.

Model: The trained model is represented by an AI model icon, including learned features or vectors, indicated by the term “Learned.”

Optimized Data: The trained model is transformed into optimized data for use in on-device AI.

On Device AI: The on-device AI operates using an inference engine and a dedicated inference chip, supporting AI functionalities on the end-user’s device, such as a smartphone, as illustrated by a device icon.

The image represents the flow from data collection, through model training and optimization, to the execution of AI within a device. This process allows AI to function independently within a personal device rather than on cloud servers, providing benefits such as reduced response times and enhanced privacy protection

The time is

From DALL-E with some prompting
The image conveys that innovation is more than just seeking new things; it is achieved through numerous changes performed within a given absolute time. The upper section shows three change attempts within a limited timeframe, suggesting that evolution occurs through these trials and failures. The lower section emphasizes the capability to undertake nine changes in the same time period, highlighting faster and more substantial evolution. It underlines the idea that digital transformation enables more rapid and extensive changes than those made by humans, which is a crucial element in driving innovation and evolution.

DT for new biz

From DALL-E with some prompting
The image is a diagram that illustrates the process of digital transformation for discovering new business opportunities through the digitization of data center operations. The stages included are as follows:

  1. Digitization: The initial step of converting data into digital form.
  2. Digitalization: The process of enhancing operational know-how and creating new value through the experience and analysis with AI, as indicated by the phrases “Exp & Analysis with AI” and “Selling EXP and more!!”.
  3. Digital Transformation: The stage where insights and ideas gained from digitalization are actualized into new business changes.

At the bottom of the diagram, the phrase “All New for DC By Digital(data)” is accompanied by four boxes labeled Design, Deployment, Operating, and Customer. This indicates that all components of business operations are undergoing new changes based on digital data. The “NEW” marker emphasizes the new business opportunities that arise through digital transformation.

The diagram visually explains how transforming existing data into a digital format and using technologies like AI for analysis can improve operational knowledge and, as a result, generate and implement new business ideas. It specifically highlights that digital transformation in data center operations can provide opportunities for uncovering new business ventures.

ARP/RARP

From DALL-E with some prompting
The image focuses on the primary uses and applications of ARP and RARP protocols in a network. ARP (Address Resolution Protocol) is utilized to translate IP addresses into MAC addresses to ensure packets are delivered to the correct destination. This information is stored in the ARP table, facilitating packet forwarding across the Ethernet network. On the other hand, RARP (Reverse Address Resolution Protocol) has largely been superseded by DHCP (Dynamic Host Configuration Protocol). DHCP is commonly used to dynamically assign IP addresses to devices on a network and to automatically configure network setting information.

Priority

From DALL-E
The image is a visual representation of task prioritization and management. It comprises various elements that communicate the challenges and strategies of handling multiple tasks effectively:

  1. Multi-Tasking NOT EASY: This indicates that juggling multiple tasks is challenging, and one task could be affected by another, implying the potential for decreased efficiency or interference.
  2. So. The Focusing is required.: It emphasizes the need for focus, suggesting that concentrating on specific tasks is essential for successful completion.
  3. First! Need to find out Which is more priority.: This statement highlights the importance of determining which task has the highest priority to address it appropriately.
  4. Managing with Data.: It suggests that data management is a crucial part of prioritizing and executing tasks.

On the right side, there is a list numbered 1 to 5, indicating a ranked list of tasks:

  • Number 1 is circled, with an arrow pointing to it and the phrases “DO IT” and “Do it Now!!”, stressing the urgency of tackling the most important task immediately.
  • Number 5 has a question mark next to it, and the phrase “Keep it for the future more details.”, suggesting that the lowest priority task may be deferred until more information is available or it becomes more relevant.

The bottom right corner has an “X” symbol with the text “without interruption”, indicating the importance of completing the top priority task without distractions or interruptions. The overall message of the image is to prioritize tasks, focus on the most critical one, manage tasks based on data, and execute them without disruption for effective productivity.

Read-copy update

From DALL-E with some prompting
The image explains the “Read-Copy Update” mechanism, illustrating the process of reading and writing data in concurrent programming divided into two parts.

The left section, accompanied by the phrase “Easy to Read,” shows arrows from three gear icons pointing towards a document icon. This represents the “Wait-Free Reads” process, indicating that multiple threads can read data simultaneously without waiting.

The right section, labeled “Complex to Write,” demonstrates that the writing process is more complicated. During the “Grace Period,” the old data can still be read, but after copying is finished, the new data is read. During this period, the old data is subject to “Old → Garbage Collection,” meaning it will be discarded through garbage collection. This mechanism ensures that data reads are not blocked while the data is being updated.

The Read-Copy Update is a strategy used in systems handling concurrency to maintain data consistency while optimizing the performance of read operations. Although the process of writing data is complex, the mechanism is designed to allow reads to be simple and fast.

Road to “the new”

From DALL-E with some prompting

The image visually explains the process of creating new ideas and innovations. Each stage is as follows:

Experience: The icon represents human experiences.
Digitization: The process of converting experiences into digital data.
Data: The digitized information.
AI/ML (Artificial Intelligence/Machine Learning): Technologies that analyze and learn from the data.
Accelerator: Represents the acceleration of the analysis and learning process through AI/ML.
Analysis: The process of analyzing data to extract useful insights.
Idea: The emergence of new ideas from data analysis. The phrase “Easy to Get” indicates that this process has become more accessible.
New: Two text icons depicting the implementation of new ideas into innovative products or services.


The image illustrates the flow of digitizing experiences into data, using AI/ML to analyze and accelerate this data, easily obtaining new ideas, and transforming them into new innovations.