DNS Caching SEQ

From Claude with some prompting
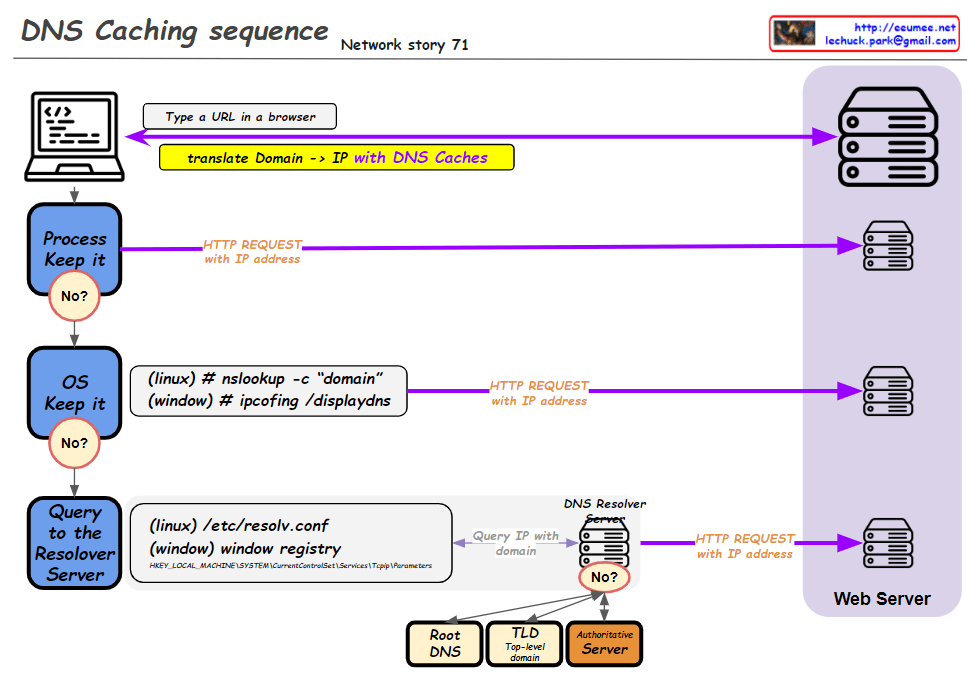
This improved diagram illustrates the DNS caching sequence more comprehensively. Here’s a breakdown of the process:

  1. A user types a URL in a browser.
  2. The system attempts to translate the domain to an IP address using DNS caches.
  3. Process Keep it: Checks the process-level DNS cache. If the information isn’t found here (“No”), it moves to the next step.
  4. OS Keep it: Checks the operating system-level DNS cache. For Linux, it uses the “nslookup -c domain” command, while for Windows, it uses “ipconfig /displaydns”. If the information isn’t found here (“No”), it proceeds to the next step.
  5. Query to the Resolver Server: The system queries the DNS resolver server. The resolver’s information is found in “/etc/resolv.conf” for Linux or the Windows Registry for Windows systems.
  6. If the resolver doesn’t have the information cached (“No”), it initiates a recursive query through the DNS hierarchy:
    • Root DNS
    • TLD (Top-Level Domain) server
    • Authoritative server
  7. Once the IP address is obtained, an HTTP request is sent to the web server.

This diagram effectively shows the hierarchical nature of DNS resolution and the fallback mechanisms at each level. It demonstrates how the system progressively moves from local caches to broader, more authoritative sources when resolving domain names to IP addresses. The addition of the DNS hierarchy (Root, TLD, Authoritative) provides a more complete picture of the entire resolution process when local caches and the initial resolver query don’t yield results.

New OS

From Claude with some prompting
This image illustrates a more comprehensive structure of a new operating system integrated with AI. Here’s a summary of the key changes and features:

  1. Cloud Connectivity: A “Cloud Connected” element has been added, linked to AI Applications. This represents the integration between local AI and cloud-based AI services.
  2. User Data Protection: The “User Data (Private)” section now includes various icons, visualizing the management of different types of user data and emphasizing privacy protection.
  3. New Interface: The Q&A-style “New Interface” is more prominently displayed, highlighting direct interaction between AI and users.
  4. AI Application Integration: AI Applications are closely connected to User Applications, the Inference Model, and User Data.
  5. Hardware Utilization: The GPU (inference) is clearly marked as specialized hardware for AI tasks.
  6. Localized Learning Data: “Learned Data (Localized)” is included as part of the system, indicating the capability to provide personalized AI experiences.

This structure offers several advantages:

  • Enhanced User Experience: Intuitive interaction through AI-based interfaces
  • Privacy Protection: Secure management of user data
  • Hybrid Cloud-Local AI: Balanced use of local processing and cloud resources
  • Performance Optimization: Efficient AI task processing through GPU
  • Personalization: Customized AI services using localized learning data

This new OS architecture integrates AI as a core component, seamlessly combining traditional OS functions with advanced AI capabilities to present a next-generation computing environment.

The Time is

From Claude with some prompting
This image explains the concept of time and its relation to gravity. Here’s a breakdown of the main points:

  1. Definition of Time:
    • It’s described as “The smallest unit of change” → “The smallest unit of time change * N” → “1 Second”.
  2. Gravity’s Influence:
    • The image states “Everything is affected by gravity.”
    • Gravity influences gear changes and signal changes, as shown by the icons.
  3. Relationship between Time and Gravity:
    • Time is affected by gravity.
    • The higher the gravity (lower place), the slower the changes, resulting in slower passage of time.
    • The lower the gravity (higher place), the faster the change, leading to faster passage of time.

This diagram simplifies one of the key concepts of Einstein’s General Theory of Relativity – how gravity affects the passage of time. It illustrates this complex idea in a straightforward, visual manner.

Everything is

From Claude with some prompting
This diagram titled “Everything is” illustrates the process of human perception and understanding:

  1. “Input” represents all information received through human senses, depicted by a group of people icons and various symbols.
  2. This input connects to “EVERYTHING”, suggesting that we perceive the world through our senses.
  3. The note “Only Meaning Very very small” indicates that the initial meaning of information at the input stage is limited.
  4. The “More & More” box represents the expansion of human understanding through two methods:
    • “Logics”: Human thought processes
    • “Auto Logics”: AI or automated thinking processes
  5. “More Micro” and “More Macro” arrows show that this expanded thinking develops into more microscopic and macroscopic perspectives.

In essence, this diagram portrays how humans receive information through their senses and process it using both human logical thinking and automated thinking (like AI). This continuous process expands our understanding of the world, allowing us to comprehend “EVERYTHING” from increasingly detailed (micro) and broad (macro) viewpoints. The diagram illustrates our journey towards a deeper and wider understanding of everything around us.