It’s in deep thought that growth begins—now, take action.
The Computing for the Fair Human Life.
It’s in deep thought that growth begins—now, take action.
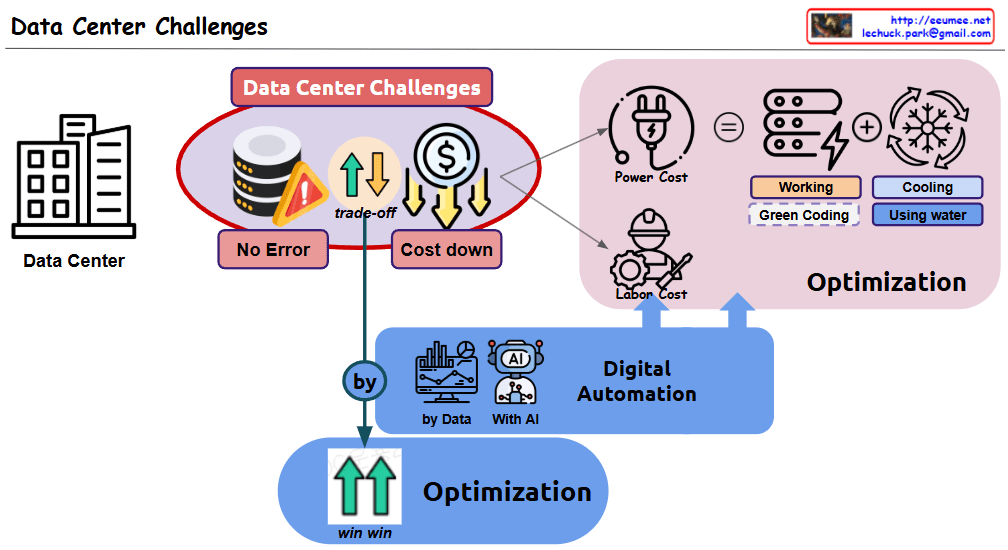
This diagram illustrates “Data Center Challenges” by visually explaining the key challenges faced by data centers and their potential solutions.
The central red circle highlights the main challenges:
The “Optimization” section on the right breaks down the cost structure:
The middle “Digital Automation” section shows:
At the bottom, the final outcome shows:
This diagram demonstrates how digital automation leveraging data and AI can help data centers achieve the seemingly conflicting goals of reliable operations and cost reduction simultaneously.
With Claude

This image illustrates a crucial difference in predictability between single-factor and multi-factor systems.
In the Sequential (Serial) model:
In contrast, the Parallel model shows:
In our actual world, purely single-factor systems rarely exist. Even seemingly simple phenomena consist of interactions between various elements. Weather, economics, ecosystems, human health, social phenomena – all real systems comprise numerous variables and their complex interrelationships. This is why real-world phenomena exhibit probabilistic characteristics, which is not merely due to our lack of knowledge but an inherent property of complex systems.
With Claude
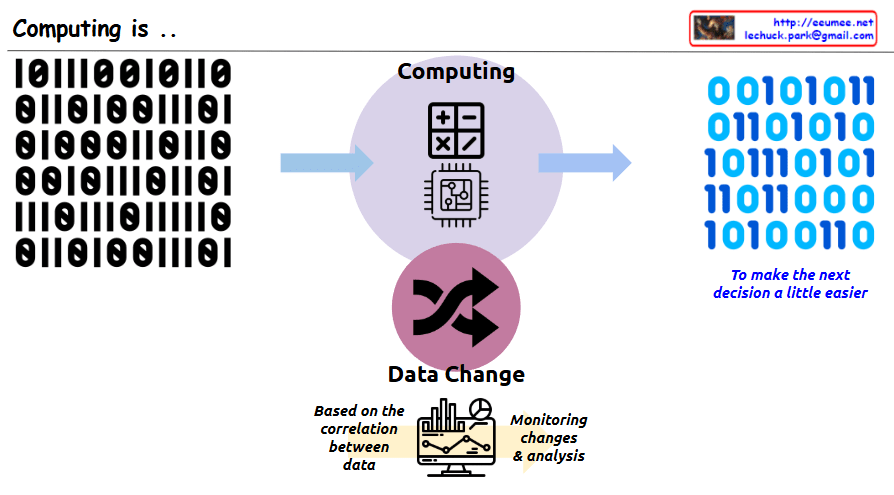
This image illustrates the core concept of “Computing.” The key message is that computing is a process of transforming data to make people’s next decisions easier.
In the center, there is a circle with the title “Computing” along with calculator and computer chip icons. On the left side, there is binary input data (0s and 1s), which is shown being transformed through the central computing process into different binary output on the right side. Next to the binary output on the right is blue italic text saying “To make the next decision a little easier,” emphasizing that the purpose of this data transformation is to aid human decision-making.
At the bottom of the image, there is a section titled “Data Change” with cycling arrows representing data transformation. Below that, there’s a monitor displaying charts and graphs with descriptions “Based on the correlation between data” and “Monitoring changes & analysis,” showing that analyzing relationships between data is important for supporting decision-making.
With Claude

This image presents a concept titled “Think by a Vector” that compares two approaches to handling data.
The image shows a data processing flow starting from what appears to be a network or system diagram on the left, which outputs binary data (represented as 0s and 1s) labeled as “Data Explosion.” This data can then be processed in two different ways:
The main message appears to be advocating for vector-based thinking or processing, which focuses on extracting and working with key features rather than processing every individual data point. This approach is presented as more efficient and effective than the raster-based approach.
With Claude

This image shows a data center architecture diagram titled “Data Center Now” at the top. It illustrates the key components and flow of a modern data center infrastructure.
The diagram depicts:
The diagram shows how data flows through processing units and connects to different infrastructure elements, emphasizing modern data center requirements like increased computing power, AI capabilities, power management, and cooling solutions.
With Claude