Metric Analysis

With a Claude
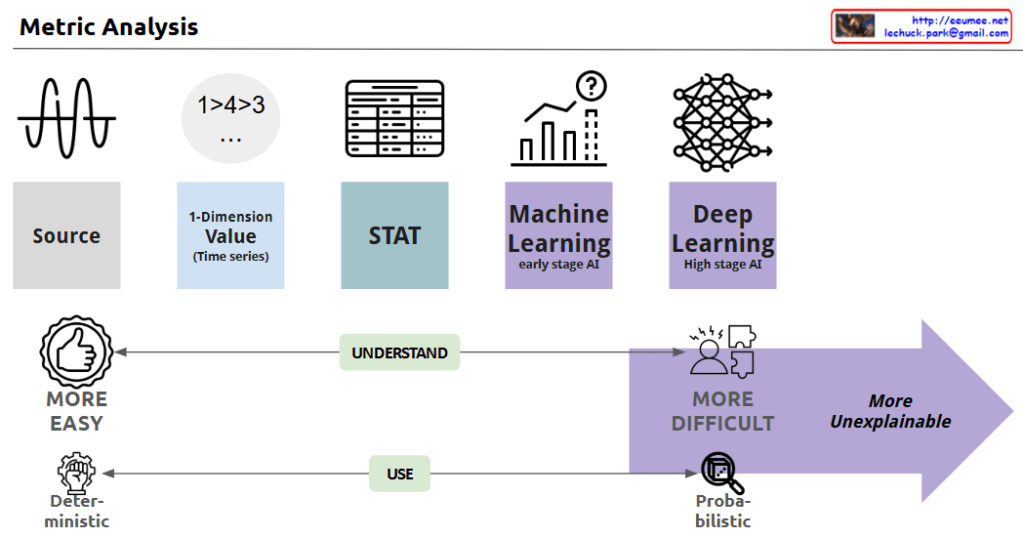
This image depicts the evolution of data analysis techniques, from simple time series analysis to increasingly sophisticated statistical methods, machine learning, and deep learning.

As the analysis approaches become more advanced, the process becomes less transparent and the results more difficult to explain. Simple techniques are more easily understood and allow for deterministic decision-making. But as the analysis moves towards statistics, machine learning, and AI, the computations become more opaque, leading to probabilistic rather than definitive conclusions. This trade-off between complexity and explainability is the key theme illustrated.

In summary, the progression shows how data analysis methods grow more powerful yet less interpretable, requiring a balance between the depth of insights and the ability to understand and reliably apply the results.

Metric Monitoring Strategy

With a Claude’s Help
the Metric Monitoring System diagram:

  1. Data Hierarchy (Top)
  • Raw Metric: Unprocessed source data
  • Made Metric: Combined metrics from related data
  • Multi-data: Interrelated metrics sets
  1. Analysis Pipeline (Bottom)

Progressive Stages:

  • Basic: Change detection, single value, delta analysis
  • Intermediate: Basic statistics (avg/min/max), standard deviation
  • Advanced: Z-score/IQR
  • ML-based: ARIMA/Prophet, LSTM, AutoEncoder

Key Features:

  • Computing power increases with complexity (left to right)
  • Correlation and dependency analysis integration
  • Two-tier ML approach: ML1 (prediction), ML2 (pattern recognition)

Implementation Benefits:

  • Resource optimization through staged processing
  • Scalable analysis from basic monitoring to predictive analytics
  • Comprehensive anomaly detection
  • Flexible system adaptable to different monitoring needs

The system provides a complete framework from simple metric tracking to advanced machine learning-based analysis, enabling both reactive and predictive monitoring capabilities.

Additional Values:

  • Early warning system potential
  • Root cause analysis support
  • Predictive maintenance enablement
  • Resource allocation optimization
  • System health forecasting

This architecture supports both operational monitoring and strategic analysis needs while maintaining resource efficiency through its graduated approach to data processing.Copy

The Era of True Artificial Intelligence: Bridging Human and Machine Learning  

AI has now reached a level that can truly be called Artificial Intelligence. This is especially evident in the era of Machine Learning (ML). Humans learn through experiences—essentially data—and make judgments and take actions based on them. These actions are not always perfect or correct, but through continuous learning and experience, they strive for better outcomes, which inherently reflects a probabilistic and statistical perspective.

Similarly, ML learns from massive datasets to identify rules and minimize errors. However, it cannot achieve 100% perfection because it cannot learn all possible data, which is essentially infinite. Despite this, recent advancements in infrastructure and access to vast amounts of data have enabled AI to reach accuracy levels of 90% to 99.99%, appearing almost perfect.

Nevertheless, there still remains the elusive 0.00…1% of uncertainty, stemming from the fundamental limitation of incomplete data learning. Ultimately, AI is not so different from humans in how it learns and makes probabilistic decisions. For this reason, we can truly call it Artificial Intelligence.

Time Series Prediction : 3 types

with a Claude’s help
This image provides an overview of different time series prediction methods, including their characteristics and applications. The key points are:

ARIMA (Autoregressive Integrated Moving Average):

  • Suitable for linear, stable datasets where interpretability is important
  • Can be used for short-term stock price prediction and monthly energy consumption forecasting

Prophet:

  • A quick and simple forecasting method with clear seasonality and trend
  • Suitable for social media traffic and retail sales predictions

LSTM (Long Short-Term Memory):

  • Suitable for dealing with nonlinear, complex, large-scale, feature-rich datasets
  • Can be used for sensor data anomaly detection, weather forecasting, and long-term financial market prediction

Application in a data center context:

  • ARIMA: Can be used to predict short-term changes in server room temperature and power consumption
  • Prophet: Can be used to forecast daily, weekly, and monthly power usage patterns
  • LSTM: Can be used to analyze complex sensor data patterns and make long-term predictions

Utilizing these prediction models can contribute to energy efficiency improvements and proactive maintenance in data centers. When selecting a prediction method, one should consider the characteristics of the data and the specific forecasting requirements.

Prediction & Detection

From Claude with some prompting
This image illustrates a Prediction and Detection system for time series data. Let me break down the key components:

  1. Left Large Box (Learning and Prediction Section):
  • Blue line: Actual Temperature data
  • Red dotted line: Predicted Temperature data
  • Uses time series prediction models like LSTM, ARIMA, and Prophet for learning
  1. Top Right (Threshold-based Anomaly Detection):
  • “Abnormal Detection with Threshold”
  • Detects abnormal temperature changes based on threshold values
  • The area marked with a red circle shows where values exceed the threshold
  • Includes “Warning” and “Critical” threshold levels
  1. Bottom Right (Pattern-based Anomaly Detection):
  • “Anomaly Detection with Predict-Pattern”
  • Compares predicted patterns with actual data to detect anomalies
  • The area marked with a green circle shows where actual data deviates from the predicted pattern

The system detects anomalies in two ways:

  1. When values exceed predetermined thresholds
  2. When actual data significantly deviates from predicted patterns

This type of system is particularly useful in:

  • Industrial monitoring
  • Equipment maintenance
  • Early warning systems
  • Quality control
  • System health monitoring

The combination of prediction and dual detection methods (threshold and pattern-based) provides a robust approach to identifying potential issues before they become critical problems.

Amazing ML

From Claude with some prompting
This diagram effectively illustrates the core principles of machine learning.

Basic Components:

  1. Number Pattern at the Top: 1 → 4 → 7 → 10 → 14
  • Presented with the question “Have a pattern??”
  1. Neural Network Diagram in the Center
  • Visualizes the machine learning process of pattern discovery
  1. Discovered Rule at the Bottom: Y = 3x + 1
  • Mathematical expression of the pattern found in the data

Key Messages:

  1. Pattern Discovery from Data
  • Using just 5 data points
  • Clear mathematical pattern can be discovered
  • Rule where each number adds 3 to the previous one
  1. Infinite Scalability
  • One simple discovered rule (Y = 3x + 1)
  • Can predict infinite data points (Infinite Data)
  • Demonstrates machine learning’s power of ‘generalization’

This diagram showcases machine learning’s most powerful characteristic:

  • Learning from limited data
  • Discovering simple yet powerful rules
  • Ability to predict infinite new cases

It’s similar to how physical laws like E = mc² can explain infinite natural phenomena with a single equation. The diagram effectively shows how machine learning serves as a powerful tool for discovering these fundamental patterns hidden within data.

The beauty of this concept lies in its simplicity and power:

  • Using just 5 visible data points
  • Finding a mathematical pattern
  • Creating a rule that can predict an infinite number of future points

This demonstrates the essence of machine learning: the ability to take finite observations and transform them into a universal rule that can make predictions far beyond the original training data.

Metric

From Claude with some prompting
the diagram focuses on considerations for a single metric:

  1. Basic Metric Components
  • Point: Measurement point (where it’s collected)
  • Number: Actual measured values (4,5,5,8,4,3,4)
  • Precision: Accuracy of measurement
  1. Time Characteristics
  • Time Series Data: Collected in time series format
  • Real Time Streaming: Real-time streaming method
  • Sampling Rate: How many measurements per second
  • Resolution: Time resolution
  1. Change Detection
  • Changes: Value variations
    • Range: Acceptable range
    • Event: Notable changes
  • Delta: Change from previous value (new-old)
  • Threshold: Threshold settings
  1. Quality Management
  • No Data: Missing data state
  • Delay: Data latency state
  • With All Metrics: Correlation with other metrics
  1. Pattern Analysis
  • Long Time Pattern: Long-term pattern existence
  • Machine Learning: Pattern-based learning potential

In summary, this diagram comprehensively shows key considerations for a single metric:

  • Collection method (how to gather)
  • Time characteristics (how frequently to collect)
  • Change detection (what changes to note)
  • Quality management (how to ensure data reliability)
  • Utilization approach (how to analyze and use)

These aspects form the fundamental framework for understanding and implementing a single metric in a monitoring system.