CDC & ETL

From Claude with some prompting
Here’s the interpretation of the image explaining CDC (Change Data Capture) and ETL (Extract, Transform, Load) processes. The diagram is divided into three main sections:

  1. Top Section:
  • Shows CDC/ETL process from “For Operating” database to “For Analysis” database.
  1. Middle Section (CDC):
  • Illustrates the Change Data Capture process
  • Shows how changes C1 through C5 are detected and captured
  • Key features:
    • Realtime processing
    • Sync Duplication
    • Efficiency
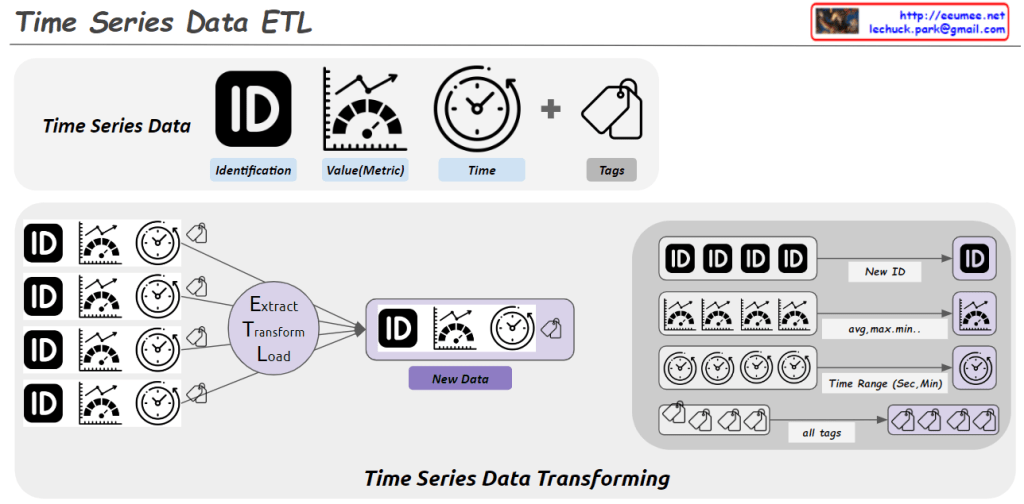
  1. Bottom Section (ETL):
  • Demonstrates traditional ETL process:
    • Extract
    • Transform
    • Load
  • Processing characteristics:
    • Batch process
    • Data Transform
    • Data Integrate

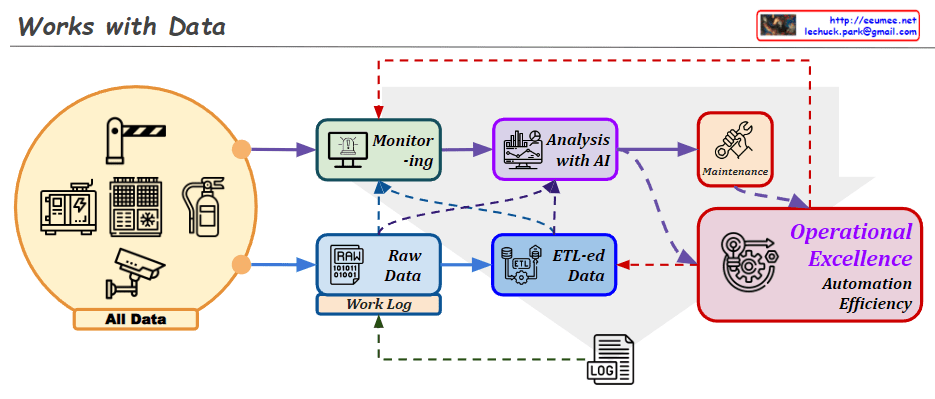
The diagram contrasts two main approaches to data integration:

  1. CDC: Real-time approach that detects and synchronizes changes as they occur
  2. ETL: Traditional batch approach that extracts, transforms, and loads data

This visualization effectively shows how CDC provides real-time data synchronization while ETL handles data in batches, each serving different use cases in data integration strategies.

A series of decisions

From Claude with some prompting
The image depicts a diagram titled “A series of decisions,” illustrating a data processing and analysis workflow. The main stages are as follows:

  1. Big Data: The starting point for data collection.
  2. Gathering Domains by Searching: This stage involves searching for and collecting relevant data.
  3. Verification: A step to validate the collected data.
  4. Database: Where data is stored and managed. This stage includes “Select Betters” for data refinement.
  5. ETL (Extract, Transform, Load): This process involves extracting, transforming, and loading data, with a focus on “Select Combinations.”
  6. AI Model: The stage where artificial intelligence models are applied, aiming to find a “More Fit AI Model.”

Each stage is accompanied by a “Visualization” icon, indicating that data visualization plays a crucial role throughout the entire process.

At the bottom, there’s a final step labeled “Select Results with Visualization,” suggesting that the outcomes of the entire process are selected and presented through visualization techniques.

Arrows connect these stages, showing the flow from Big Data to the AI Model, with “Select Results” arrows feeding back to earlier stages, implying an iterative process.

This diagram effectively illustrates the journey from raw big data to refined AI models, emphasizing the importance of decision-making and selection at each stage of the data processing and analysis workflow.

More abstracted Data & Bigger Error possibility

From Claude with some prompting
This image illustrates the data processing, analysis, and machine learning application process, emphasizing how errors can be amplified at each stage:

  1. Data Flow:
    • Starts with RAW data.
    • Goes through multiple ETL (Extract, Transform, Load) processes, transforming into new forms of data (“NEW”) at each stage.
    • Time information is incorporated, developing into statistical data.
    • Finally, it’s processed through machine learning techniques, evolving into more sophisticated new data.
  2. Error Propagation and Amplification:
    • Each ETL stage is marked with a “WHAT {IF.}” and a red X, indicating the possibility of errors.
    • Errors occurring in early stages propagate through subsequent stages, with their impact growing progressively larger, as shown by the red arrows.
    • The large red X at the end emphasizes how small initial errors can have a significant impact on the final result.
  3. Key Implications:
    • As the data processing becomes more complex, the quality and accuracy of initial data become increasingly crucial.
    • Thorough validation and preparation for potential errors at each stage are necessary.
    • Particularly for data used in machine learning models, initial errors can be amplified, severely affecting model performance, thus requiring extra caution.

This image effectively conveys the importance of data quality management in data science and AI fields, and the need for systematic preparation against error propagation. It highlights that as data becomes more abstracted and processed, the potential impact of early errors grows, necessitating robust error mitigation strategies throughout the data pipeline.

Time Series Data ETL

From Claude with some prompting
This image illustrates the “Time Series Data ETL” (Extract, Transform, Load) process.

Key components of the image:

  1. Time Series Data structure:
    • Identification (ID): Data identifier
    • Value (Metric): Measured value
    • Time: Timestamp
    • Tags: Additional metadata
  2. ETL Process:
    • Multiple source data points go through the Extract, Transform, Load process to create new transformed data.
  3. Data Transformation:
    • New ID: Generation of a new identifier
    • avg, max, min…: Statistical calculations on values (average, maximum, minimum, etc.)
    • Time Range (Sec, Min): Time range adjustment (in seconds, minutes)
    • all tags: Combination of all tag information

This process demonstrates how raw time series data is collected, transformed as needed, and prepared into a format suitable for analysis or storage. This is a crucial step in large-scale data processing and analysis.

The diagram effectively shows how multiple data points with IDs, values, timestamps, and tags are consolidated and transformed into a new data structure with aggregated information and adjusted time ranges.

Time Series Data

From Claude with some prompting

  1. Raw Time Series Data:
    • Data Source: Sensors or meters operating 24/7, 365 days a year
    • Components: a. Point: The data point being measured b. Metric: The measurement value for each point c. Time: When the data was recorded
    • Format: (Point, Value, Time)
    • Additional Information: a. Config Data: Device name, location, and other setup information b. Tag Info: Additional metadata or classification information for the data
    • Characteristics:
      • Continuously updated based on status changes
      • Automatically changes over time
  2. Processed Time Series Data (2nd logical Data):
    • Processing Steps: a. ETL (Extract, Transform, Load) operations b. Analysis of correlations between data points (Point A and Point B) c. Data processing through f(x) function
      • Creating formulas through correlations using experience and AI learning
    • Result:
      • Generation of new data points
      • Includes original point, related metric, and time information
    • Characteristics:
      • Provides more meaningful and correlated information than raw data
      • Reflects relationships and influences between data points
      • Usable for more complex analysis and predictions

Through this process, Raw Time Series Data is transformed into more useful and insightful Processed Time Series Data. This aids in understanding data patterns and predicting future trends.

Works with data

From DALL-E with some prompting
The image describes a data workflow process that involves various stages of data handling and utilization for operational excellence. “All Data” from diverse sources feeds into a monitoring system, which then processes raw data, including work logs. This raw data undergoes ETL (Extract, Transform, Load) procedures to become structured “ETL-ed Data.” Following ETL, the data is analyzed with AI to extract insights and inform decisions, which can lead to actions such as maintenance. The ultimate goal of this process is to achieve operational excellence, automation, and efficiency.