Analytical vs Empirical

Analytical vs Empirical Approaches

Analytical Approach

  1. Theory Driven: Based on mathematical theories and logical reasoning
  2. Programmable with Design: Implemented through explicit rules and algorithms
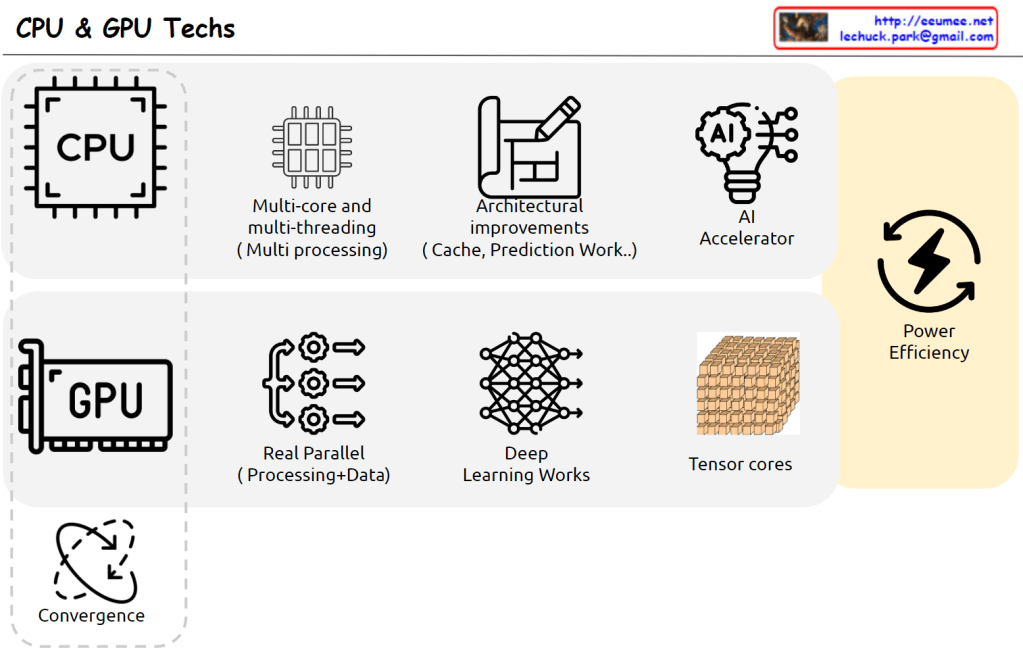
  3. Sequential by CPU: Tasks are processed one at a time in sequence
  4. Precise & Explainable: Results are accurate and decision-making processes are transparent

Empirical Approach

  1. Data Driven: Based on real data and observations
  2. Deep Learning with Learn: Neural networks automatically learn from data
  3. Parallel by GPU: Multiple tasks are processed simultaneously for improved efficiency
  4. Approximate & Unexplainable: Results are approximations and internal workings are difficult to explain
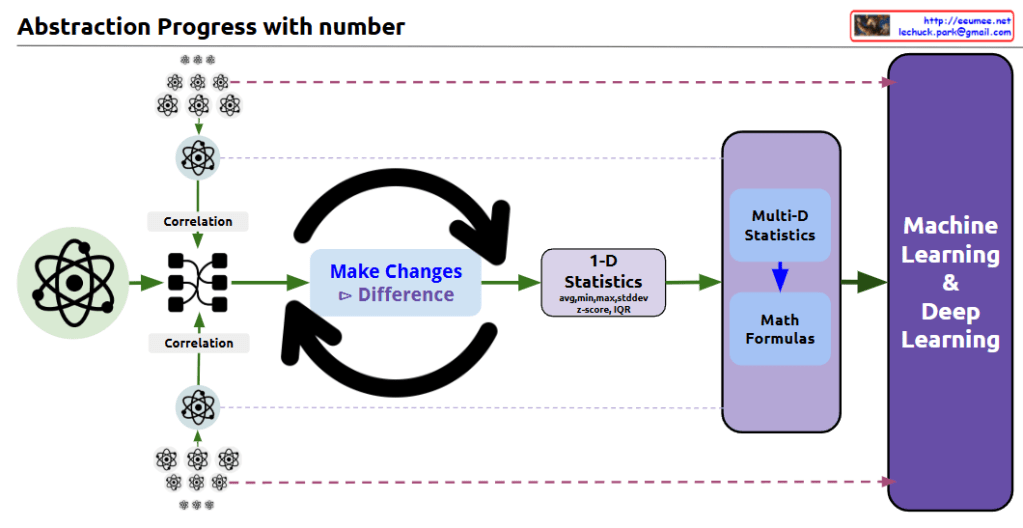
Summary

This diagram illustrates the key differences between traditional programming methods and modern machine learning approaches. The analytical approach follows clearly defined rules designed by humans and can precisely explain results, while the empirical approach learns patterns from data and improves efficiency through parallel processing but leaves decision-making processes as a black box.

with claude

The Age of Utilization

This image is an infographic depicting “The Age of Utilization.”

On the left side, a gray oval contains “All knowledge of mankind” represented by various icons including letter and number blocks, books with writing tools, and a globe symbolizing the internet, illustrating the diverse forms of knowledge humanity has accumulated over time.

In the center, there’s a section labeled “Massive parallel processing” showing multiple eye icons with arrows pointing toward a GPU icon. This illustrates how vast amounts of human knowledge are efficiently processed through GPUs.

On the right side, a purple arrow-shaped area labeled “Easy to utilize” demonstrates how processed information can be used. At the top is an “EASY TO USE” icon, with “Inference” and “Learning” stages below it. This section includes Q&A icons, a vector database, and neural network structures.

The infographic comprehensively shows how humanity has entered a new era where accumulated knowledge can be processed using modern technology and easily accessed through question-and-answer formats, making all human knowledge readily available for utilization.

With Claude

GPU vs NPU on Deep learning

This diagram illustrates the differences between GPU and NPU from a deep learning perspective:

GPU (Graphic Process Unit):

  • Originally developed for 3D game rendering
  • In deep learning, it’s utilized for parallel processing of vast amounts of data through complex calculations during the training process
  • Characterized by “More Computing = Bigger Memory = More Power,” requiring high computing power
  • Processes big data and vectorizes information using the “Everything to Vector” approach
  • Stores learning results in Vector Databases for future use

NPU (Neuron Process Unit):

  • Retrieves information from already trained Vector DBs or foundation models to generate answers to questions
  • This process is called “Inference”
  • While the training phase processes all data in parallel, the inference phase only searches/infers content related to specific questions to formulate answers
  • Performs parallel processing similar to how neurons function

In conclusion, GPUs are responsible for processing enormous amounts of data and storing learning results in vector form, while NPUs specialize in the inference process of generating actual answers to questions based on this stored information. This relationship can be summarized as “training creates and stores vast amounts of data, while inference utilizes this at the point of need.”

With Claude

Abstraction Progress with number

With Claude
this diagram shows the progression of data abstraction leading to machine learning:

  1. The process begins with atomic/molecular scientific symbols, representing raw data points.
  2. The first step shows ‘Correlation’ analysis, where relationships between multiple data points are mapped and connected.
  3. In the center, there’s a circular arrow system labeled ‘Make Changes’ and ‘Difference’, indicating the process of analyzing changes and differences in the data.
  4. This leads to ‘1-D Statistics’, where basic statistical measures are calculated, including:
    • Average
    • Median
    • Standard deviation
    • Z-score
    • IQR (Interquartile Range)
  5. The next stage incorporates ‘Multi-D Statistics’ and ‘Math Formulas’, representing more complex statistical analysis.
  6. Finally, everything culminates in ‘Machine Learning & Deep Learning’.

The diagram effectively illustrates the data science abstraction process, showing how it progresses from basic data points through increasingly complex analyses to ultimately reach machine learning and deep learning applications.

The small atomic symbols at the top and bottom of the diagram visually represent how multiple data points are processed and analyzed through this system. This shows the scalability of the process from individual data points to comprehensive machine learning systems.

The overall flow demonstrates how raw data is transformed through various statistical and mathematical processes to become useful input for advanced machine learning algorithms. CopyRet

CPU + GPU

From Claude with some prompting
This image outlines the latest trends and developments in CPU and GPU technologies. The key points are:

  1. CPU: It shows advancements in multi-core and multi-threading (multi-processing) capabilities, as well as architectural improvements (cache, prediction work).
  2. GPU: It highlights the improvements in real-time parallel processing and data-centric processing capabilities.
  3. AI Accelerator: Hardware technologies that accelerate AI algorithms are evolving.
  4. Power Efficiency: Improving power efficiency is emerging as an important challenge.
  5. Convergence: The image suggests a trend of convergence and integration between CPUs and GPUs.

Overall, the image presents the evolving directions where CPU and GPU technologies are complementing each other and converging. This is expected to drive improvements in performance and power efficiency.

the key components of a Mixture of Experts

From Claude with some prompting
This image illustrates the key components of a Mixture of Experts (MoE) model architecture. An MoE model combines the outputs of multiple expert networks to produce a final output.

The main components are:

  1. Expert Network: This represents a specialized neural network trained for a specific task or inputs. Multiple expert networks can exist in the architecture.
  2. Weighting Scheme: This component determines how to weight and combine the outputs from the different expert networks based on the input data.
  3. Routing Algorithm: This algorithm decides which expert network(s) should handle a given input based on the specific inputs. It essentially routes the input data to the appropriate expert(s).

The workflow is as follows: The specific inputs are fed into the routing algorithm (3), which decides which expert network(s) should process those inputs. The selected expert network(s) (1) process the inputs and generate outputs. The weighting scheme (2) then combines these expert outputs into a final output based on a small neural network.

The key idea is that different expert networks can specialize in different types of inputs or tasks, and the MoE architecture can leverage their collective expertise by routing inputs to the appropriate experts and combining their outputs intelligently.

Time Series Data in a DC

From Claude with some prompting
This image illustrates the concept of time series data analysis in a data center environment. It shows various infrastructure components like IT servers, networking, power and cooling systems, security systems, etc. that generate continuous data streams around the clock (24 hours, 365 days).

This time series data is then processed and analyzed using different machine learning and deep learning techniques such as autoregressive integrated moving average models, generalized autoregressive conditional heteroskedasticity, isolation forest algorithms, support vector machines, local outlier factor, long short-term memory models, and autoencoders.

The goal of this analysis is to gain insights, make predictions, and uncover patterns from the continuous data streams generated by the data center infrastructure components. The analysis results can be further utilized for applications like predictive maintenance, resource optimization, anomaly detection, and other operational efficiency improvements within the data center.