Data Gravity

With Claude’s help
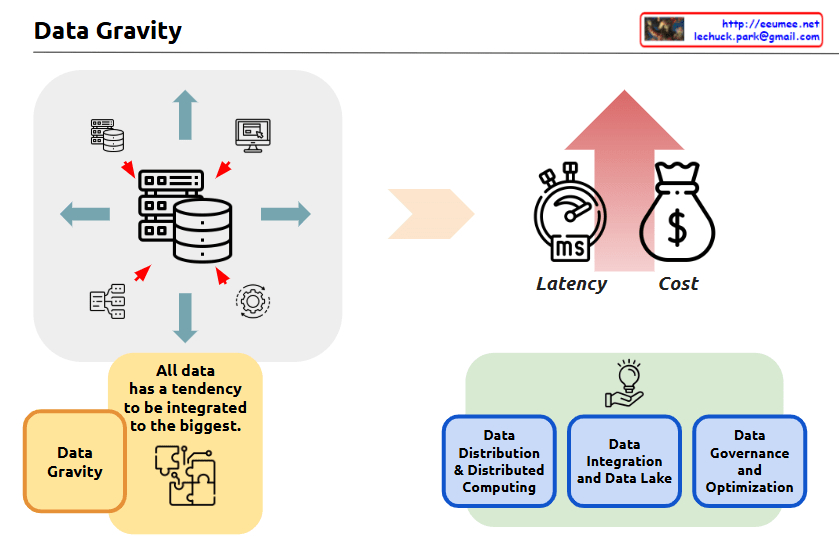
The image is titled “Data Gravity” and it appears to be an infographic or diagram that illustrates some key concepts related to data and data management.

The central part of the image shows a set of icons and arrows, depicting how “all data has a tendency to be integrated to the biggest” – this is the concept of “Data Gravity” mentioned in the title.

The image also highlights three key factors related to data:

  1. Latency – Represented by a stopwatch icon, indicating the time or delay factor involved in data processing and movement.
  2. Cost – Represented by a money bag icon, indicating the financial considerations around data management and processing.
  3. Data Gravity – This concept is explained in the yellow box, where it states that “all data has a tendency to be integrated to the biggest.”

The image also shows three main components related to data management:

  1. Data Distribution & Distributed Computing
  2. Data Integration and Data Lake
  3. Data Governance and Optimization

These three components are depicted in the bottom half of the image, illustrating the different aspects of managing and working with data.

Overall, the image seems to be providing a high-level overview of key concepts and considerations around data management, with a focus on the idea of “Data Gravity” and how it relates to factors like latency, cost, and the various data management practices.

Operating with a dev Platform

with a Claude’s help
The main points covered in this image are:

  1. Increased Size and Complexity of Data
  • The central upward-pointing arrow indicates that the size and complexity of data is increasing.
  1. Key Operational Objectives
  • The three main operational goals presented are Stability, Efficiency, and an “Unchangeable Objective”.
  • Stability is represented by the 24/7 icon, indicating the need for continuous, reliable operation.
  • Efficiency is depicted through various electrical/mechanical icons, suggesting the need for optimized resource utilization.
  • The “Unchangeable Objective” is presented as a non-negotiable goal.
  1. Integration, Digital Twin, and AI-based Development Platform
  • To manage the increasing data and operations, the image shows the integration of technologies like Digital Twin.
  • An AI-powered Development Platform is also illustrated, which can “make it [the operations] itself with experience”.
  • This Development Platform seems to leverage AI to help achieve the stability, efficiency, and unchangeable objectives.
  1. Interconnected Elements
  • The image demonstrates the interconnected nature of the growing data, the key operational requirements, and the technological solutions.
  • The Development Platform acts as a hub, integrating data and AI capabilities to support the overall operational goals.

In summary, this image highlights the challenges posed by the increased size and complexity of data that organizations need to manage. It presents the core operational objectives of stability, efficiency, and immutable goals, and suggests that an integrated, AI-powered development platform can help address these challenges by leveraging the synergies between data, digital technologies, and autonomous problem-solving capabilities.

CDC & ETL

From Claude with some prompting
Here’s the interpretation of the image explaining CDC (Change Data Capture) and ETL (Extract, Transform, Load) processes. The diagram is divided into three main sections:

  1. Top Section:
  • Shows CDC/ETL process from “For Operating” database to “For Analysis” database.
  1. Middle Section (CDC):
  • Illustrates the Change Data Capture process
  • Shows how changes C1 through C5 are detected and captured
  • Key features:
    • Realtime processing
    • Sync Duplication
    • Efficiency
  1. Bottom Section (ETL):
  • Demonstrates traditional ETL process:
    • Extract
    • Transform
    • Load
  • Processing characteristics:
    • Batch process
    • Data Transform
    • Data Integrate

The diagram contrasts two main approaches to data integration:

  1. CDC: Real-time approach that detects and synchronizes changes as they occur
  2. ETL: Traditional batch approach that extracts, transforms, and loads data

This visualization effectively shows how CDC provides real-time data synchronization while ETL handles data in batches, each serving different use cases in data integration strategies.

Distributed System

From Claude with some prompting
This distributed system architecture can be broadly divided into five core areas:

1. CAP Theory-Based System Structure

  • CP (Consistency + Partition Tolerance) Systems
    • Supports real-time synchronization
    • Ensures strong data consistency
  • AP (Availability + Partition Tolerance) Systems
    • Continues service operation even in fault situations (Fault but Services OK)
    • Ensures availability through failover

2. Data Replication Strategies

  • Write (Master): Write operations are centered on the master node.
  • Read: Read-only nodes handle data reading.
  • Write & Read: Supports both read and write operations.
  • Multiple Node Writes (1, 2, 3): Supports distributed write operations across multiple nodes.

3. Scalability Patterns

  • Scale Up: Vertical scaling
  • Scale Out: Horizontal scaling
  • Provides flexible system scalability.

4. Partition Tolerance

  • Handles network partitioning
  • Ensures service continuity even in disconnected states (disconnected but Services OK)
  • Maintains independence between nodes

5. Fault Tolerance Mechanisms

  • Duplication: Data replication
  • Error Correction: Error correction mechanisms
  • Fault Block: Fault isolation
  • Ensures stable system operations

Key Design Considerations:

Trade-off Management:

  • Choose between CP and AP systems
  • Balance consistency and availability

Service-Specific Approach:

  • For single services: Focus on managing the service in a distributed environment

Data Management:

  • Real-time synchronization
  • Replication strategies
  • Fault recovery

System Stability:

  • Error handling
  • Fault isolation
  • Service continuity

These elements should be implemented in an integrated manner, considering their interconnections in distributed system design. Finding the right balance according to business requirements is essential.

Data with the AI

From Claude with some prompting
the key points from the diagram:

  1. Reality of Internet Open Data:
    • Vast amount of open data exists on the internet including:
      • Mobile device data
      • Email communications
      • Video content
      • Location data
    • This open data is utilized by major AI companies for LLM training
    • Key players:
      • OpenAI’s ChatGPT
      • Anthropic’s Claude
      • Google’s Gemini
      • Meta’s LLaMA
  2. Competition Implications:
    • Competition between LLMs trained on similar internet data
    • “Who Winner?” and “A Winner Takes ALL?” suggests potential monopoly in the base LLM market
    • This refers specifically to models trained on public internet data
  3. Market Outlook:
    • While the base LLM market might be dominated by a few players
    • Private enterprise data remains a key differentiator
    • “Still Differentiated and Competitive” indicates ongoing competition through enterprise-specific data
    • Companies can leverage RAG-like technology to combine their private data with LLMs for unique solutions
  4. Key Implications:
    • Base LLM market (trained on internet data) may be dominated by few winners
    • Enterprise competition remains vibrant through:
      • Unique private data assets
      • RAG integration with base LLMs
      • Company-specific implementations
    • Market likely to evolve into dual structure:
      • Foundation LLMs (based on internet data)
      • Enterprise-specific AI services (leveraging private data)

This structure suggests that while base LLM technology might be dominated by a few players, enterprises can maintain competitive advantage through their unique private data assets and specialized implementations using RAG-like technologies.

This creates a market where companies can differentiate themselves even while using the same foundation models, by leveraging their proprietary data and specific use-case implementations.

synchronization

From Claude with some prompting
This diagram illustrates different types of synchronization methods. It presents 4 main types:

  1. Copy
  • A simple method where data from one side is made identical to the other
  • Characterized by “Make same thing”
  • One-directional data transfer
  1. Replications
  • A method that detects (“All Changes Sensing”) and reflects all changes
  • Continuous data replication occurs
  • Changes are sensed and reflected to maintain consistency
  1. Synchronization
  • A bi-directional method where both sides “Keep the Same”
  • Synchronization occurs through a central data repository
  • Both sides maintain identical states through mutual updates
  1. Process Synchronization
  • Synchronization between processes (represented by gear icons)
  • Features “Noti & Detect All Changes” mechanism
  • Uses a central repository for process synchronization
  • Ensures coordination between different processes

The diagram progressively shows how each synchronization method operates, from simple unidirectional copying to more complex bidirectional process synchronization. Each method is designed to maintain consistency of data or processes, but with different levels of complexity and functionality. The visual representation effectively demonstrates the flow and relationship between different components in each synchronization type.

The image effectively uses icons and arrows to show the direction and nature of data/process flow, making it easy to understand the different levels of synchronization complexity and their specific purposes in system design.