Trend & Prediction

From Claude with some prompting
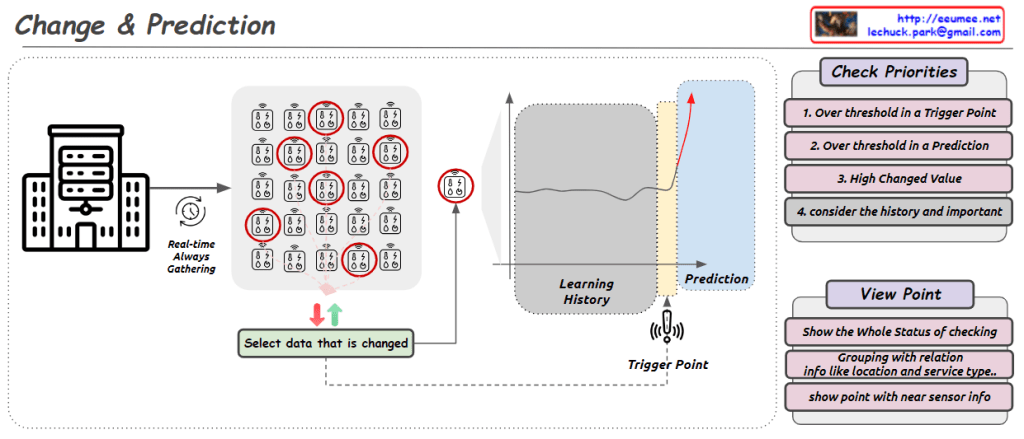
The image presents a “Trend & Predictions” process, illustrating a data-driven prediction system. The key aspect is the transition from manual validation to automation.

  1. Data Collection & Storage: Digital data is gathered from various sources and stored in a database.
  2. Manual Selection & Validation: a. User manually selects which metric (data) to use b. User manually chooses which AI model to apply c. Analysis & Confirmation using selected data and model
  3. Transition to Automation:
    • Once optimal metrics and models are confirmed in the manual validation phase, the system learns and switches to automation mode. a. Automatically collects and processes data based on selected metrics b. Automatically applies validated models c. Applies pre-set thresholds to prediction results d. Automatically detects and alerts on significant predictive patterns or anomalies based on thresholds

The core of this process is combining user expertise with system efficiency. Initially, users directly select metrics and models, validating results to “educate” the system. This phase determines which data is meaningful and which models are accurate.

Once this “learning” stage is complete, the system transitions to automation mode. It now automatically collects, processes data, and generates predictions using user-validated metrics and models. Furthermore, it applies preset thresholds to automatically detect significant trend changes or anomalies.

This enables the system to continuously monitor trends, providing alerts to users whenever important changes are detected. This allows users to respond quickly, enhancing both the accuracy of predictions and the efficiency of the system.

Anyway, The probability

From Claude with some prompting
Traditional View: AI’s probability-based decisions are seen in contrast to human’s logical, “100% certain” decisions, and this difference could be perceived as problematic.

New Insight: In reality, the concept of human’s “100% certainty” itself might be an illusion. Human judgments are also based on limited data and experiences, making them inherently probabilistic in nature.

Finding Common Ground: Both humans and AI make decisions based on incomplete information. Even human’s logical certainty ultimately stems from restricted data, making it fundamentally probability-based.

Paradigm Shift: This perspective suggests that AI’s probabilistic approach isn’t a flaw but rather a more accurate modeling of human decision-making processes. What we believe to be “100% certainty” is actually a high-probability estimation based on limited information.

Implications: This prompts a reevaluation of the perceived gap between AI and human decision-making styles. AI’s probabilistic approach might not be inferior to human logic; instead, it may more accurately reflect our cognitive processes.

This viewpoint encourages us to see AI’s probabilistic tendencies not as a problem, but as a tool providing deeper insights into human thought processes. It invites us to reconsider how AI and humans collaborate, opening new possibilities to complementarily leverage the strengths of both sides.

The image and your interpretation together challenge the notion that human reasoning is purely logical and certain. Instead, they suggest that both human and AI decisions are fundamentally based on probabilities derived from limited data. This realization can foster a more harmonious and effective partnership between humans and AI, recognizing that our decision-making processes may be more similar than previously thought.

Change & Prediction

From Claude with some prompting
This image illustrates a process called “Change & Prediction” which appears to be a system for monitoring and analyzing real-time data streams. The key components shown are:

  1. Real-time data gathering from some source (likely sensors represented by the building icon).
  2. Selecting data that has changed significantly.
  3. A “Learning History” component that tracks and learns from the incoming data over time.
  4. A “Trigger Point” that detects when data values cross certain thresholds.
  5. A “Prediction” component that likely forecasts future values based on the learned patterns.

The “Check Priorities” box lists four criteria for determining which data points deserve attention: exceeding trigger thresholds, predictions crossing thresholds, high change values, and considering historical context.

The “View Point” section suggests options for visualizing the status, grouping related data points (e.g., by location or service type), and showing detailed sensor information.

Overall, this seems to depict an automated monitoring and predictive analytics system for identifying and responding to important changes in real-time data streams from various sources or sensors.

Questions

From Claude with some prompting
This image highlights the significance of questions in the AI era and how those questions originate from humanity’s accumulated knowledge. The process begins with “Sensing the world” by gathering various inputs. However, the actual generation of questions is driven by humans. Drawing upon their existing knowledge and insights, humans formulate meaningful inquiries.

These human-generated questions then drive a combined research and analysis effort leveraging both AI systems and human capabilities. AI provides immense data processing power, while humans contribute analysis and interpretation to create new knowledge. This cyclical process allows for continuously refining and advancing the questions.

The ultimate goal is to “Figure out!!” – to achieve better understanding and solutions through the synergy of human intellect and AI technologies. For this, the unique human capacity for insight and creativity in asking questions is essential.

The image underscores that even in an AI-driven world, the seeds of inquiry and the formulation of profound questions stem from the knowledge foundation built by humans over time. AI then complements and accelerates the path toward enhanced comprehension by augmenting human cognition with its processing prowess.

Time Series Data in a DC

From Claude with some prompting
This image illustrates the concept of time series data analysis in a data center environment. It shows various infrastructure components like IT servers, networking, power and cooling systems, security systems, etc. that generate continuous data streams around the clock (24 hours, 365 days).

This time series data is then processed and analyzed using different machine learning and deep learning techniques such as autoregressive integrated moving average models, generalized autoregressive conditional heteroskedasticity, isolation forest algorithms, support vector machines, local outlier factor, long short-term memory models, and autoencoders.

The goal of this analysis is to gain insights, make predictions, and uncover patterns from the continuous data streams generated by the data center infrastructure components. The analysis results can be further utilized for applications like predictive maintenance, resource optimization, anomaly detection, and other operational efficiency improvements within the data center.

Industrial Automation

From Claude with some prompting
This image depicts the hierarchical structure of an industrial automation system.

At the lowest level, the Internal Works handle the internal control of individual devices.

At the Controller Works level, separate PLCs (Programmable Logic Controllers) are used for control because the computing power of the equipment itself is insufficient for complex program control.

The Group Works level integrates and manages groups of similar or identical equipment.

The Integration Works level integrates all the equipment through PLCs.

At the highest level, there is a database, HMI (Human-Machine Interface), monitoring/analytics systems, etc. This integrated analytics system does not directly control the equipment but rather manages the configuration information for control. AI technologies can also be applied at this level.

Through this hierarchical structure, the entire industrial automation system can be operated and managed efficiently and in an integrated manner.

Evolution and AI

From Claude with some prompting
The image metaphorically connects the process of evolution in the universe with the development stages of AI. After the Big Bang and the subsequent increase in entropy (disorder), life forms evolved through a process of self-organization, creating complex and ordered structures, thereby continuously decreasing entropy as long as life exists in the universe. Similarly, the image suggests that data-intensive AI systems will emerge as the next evolutionary stage after humans.

However, a critical point made is that the data driving AI itself does not possess any inherent intent or purpose, unlike living organisms. Data is merely a collection of information without any intrinsic goals or consciousness. Therefore, it is crucial to imbue the data with appropriate values and ethical principles to prevent AI from spiraling out of human control and indiscriminately increasing entropy.

Ultimately, this image emphasizes the importance of human-centric, value-driven AI development. Rather than warning against AI technology itself, it cautions against the unbridled advancement of data-driven AI systems without proper oversight and ethical frameworks in place, as imposed by humans.

Furthermore, the image implies that while life and AI may continue to evolve, decreasing entropy in the process, they will ultimately succumb to the universal law of increasing entropy and reach a state of thermodynamic equilibrium.

In essence, the image thoughtfully juxtaposes scientific concepts of entropy, evolution, and the emergence of AI, highlighting the need for responsible and value-aligned AI development under human guidance, while acknowledging the overarching principles of entropy and equilibrium that govern the universe.