Humans are affected by numerous external factors such as food, sleep, family, and work, causing distractions and fatigue, whereas AI operates solely based on its predefined purpose, continuously performing the same task as long as it has power.
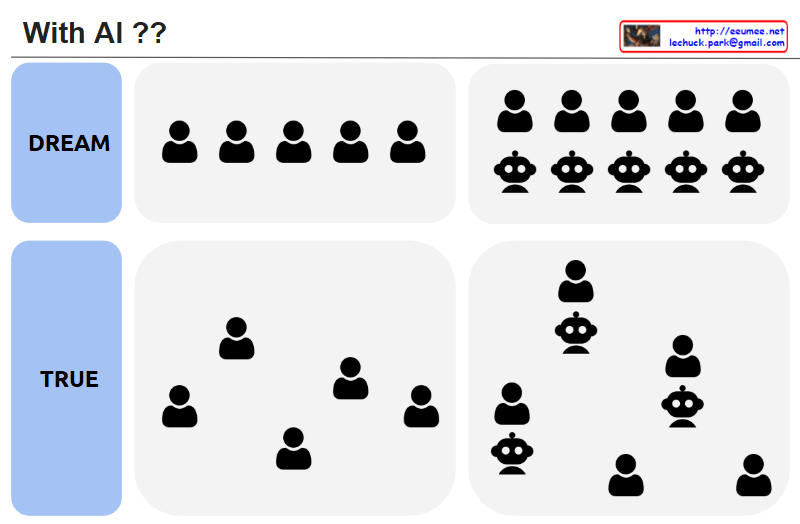
The image is divided into “DREAM” (ideal) and “TRUE” (reality), contrasting human society and AI integration scenarios.
2. Human Society Representation
Ideal (DREAM)
All human icons positioned at the same height
Symbolizes perfect social equality
Presents a utopian vision without hierarchical or power differences
Reality (TRUE)
Human icons placed irregularly at different heights
Reflects the inevitable existence of social hierarchy and power structures
Suggests that perfect equality is difficult to achieve in reality
3. AI and Human Relationship
Ideal (DREAM)
AI icons aligned uniformly below human icons
Represents AI under complete human control
Expresses the expectation that humans can perfectly control AI as a tool
Reality (TRUE)
AI and human icons randomly placed at various heights
Some AI icons positioned higher than humans
Indicates that AI may surpass human capabilities or authority in certain domains
4. Key Messages
Perfect equality in human society remains an ideal, while reality always contains some form of hierarchy.
The expectation of complete control over AI may be unrealistic, as AI can potentially exceed human capabilities in specific areas.
It’s important to acknowledge and understand the gap between ideals and reality.
5. Overall Implications
The image effectively visualizes the disconnect between our expectations and reality in both human social structures and AI integration. It suggests that while we may dream of perfect equality and control, the reality is more complex and unpredictable, requiring us to adapt our understanding and expectations accordingly.
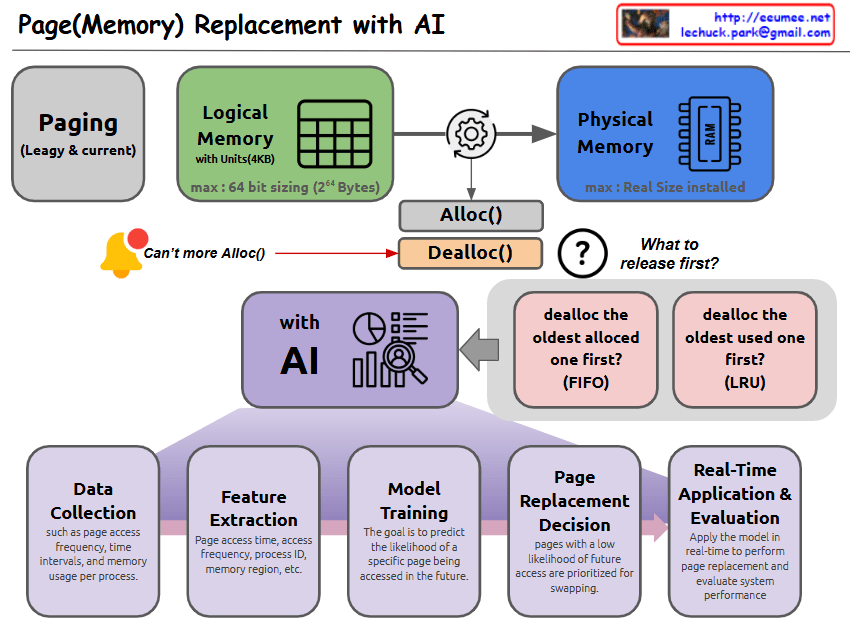
With Claude This image illustrates a Page (Memory) Replacement system using AI. Let me break down the key components:
Top Structure:
Paging (Legacy & current): Basic paging system structure
Logical Memory: Organized in 4KB units, maximum 64-bit sizing (2^64 Bytes)
Physical Memory: Limited to the actual installed memory size
Memory Allocation:
Shows Alloc() and Dealloc() functions
When no more allocation is possible, there’s a question about deallocation strategy:
FIFO (First In First Out): Deallocate the oldest allocated memory first
LRU (Least Recently Used): Deallocate the oldest used memory first
AI-based Page Replacement Process:
Data Collection: Gathers information about page access frequency, time intervals, and memory usage patterns
Feature Extraction: Analyzes page access time, access frequency, process ID, memory region, etc.
Model Training: Aims to predict the likelihood of specific pages being accessed in the future
Page Replacement Decision: Pages with a low likelihood of future access are prioritized for swapping
Real-Time Application & Evaluation: Applies the model in real-time to perform page replacement and evaluate system performance
This system integrates traditional page replacement algorithms with AI technology to achieve more efficient memory management. The use of AI helps in making more intelligent decisions about which pages to keep in memory and which to swap out, based on learned patterns and predictions.
ML/DL (Machine Learning/Deep Learning): Huge-dimensional analysis including exceptions
Bottom Indicators’ Changes:
Data/Computing/Complexity:
Marked as “Up and Up” and increases “Dramatically” towards the right
Accuracy:
Left: “100% with no other external conditions”
Right: “not 100%, up to 99.99% from all data”
Comprehensibility:
Left: “Understandable/Explainable”
Right: “Unexplainable”
Actionability:
Left: “Easy to Action”
Right: “Difficult to Action require EXP” (requires expertise)
This diagram illustrates the trade-offs in the evolution of data analysis. As analysis methods progress from simple one-dimensional analysis to complex ML/DL, while the sophistication and complexity of analysis increase, there’s a decrease in comprehensibility and ease of implementation. It shows how more advanced analysis techniques, while powerful, require greater expertise and may be less transparent in their decision-making processes.
The progression also demonstrates how modern analysis methods can handle increasingly complex data but at the cost of reduced explainability and the need for specialized knowledge to implement them effectively.
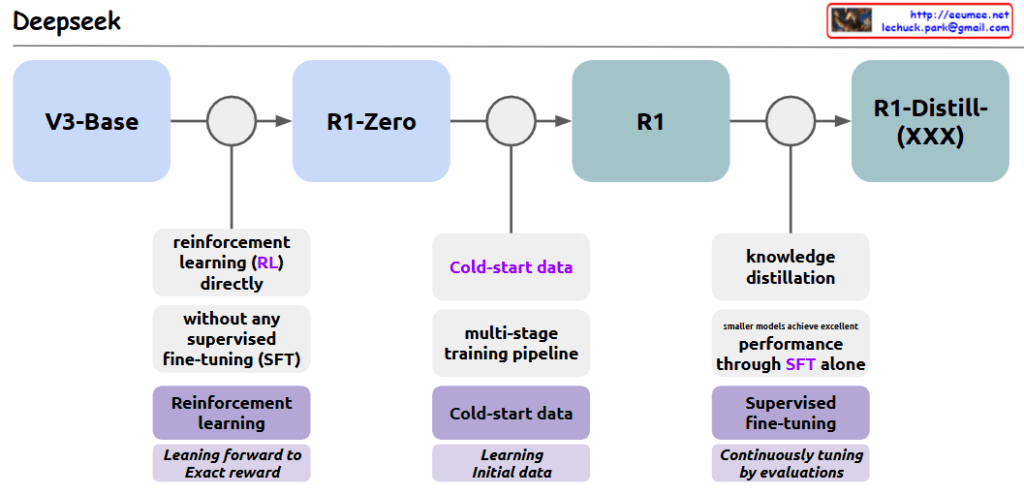
With Claude The evolution pipeline of the Deepseek model consists of three major stages:
Stage 1: V3-Base → R1-Zero
Direct application of Reinforcement Learning (RL)
Proceeds without Supervised Fine-tuning (SFT)
Adopts learning approach toward exact reward
Performs basic data classification tasks
Stage 2: R1-Zero → R1
Utilizes cold-start data for learning
Implements multi-stage training pipeline
Conducts foundational learning with initial data
Applies systematic multi-stage learning process
Stage 3: R1 → R1-Distill-(XXX)
Model optimization through knowledge distillation
Smaller models achieve excellent performance through SFT alone
Continuous model tuning through evaluations
Performance enhancement through learning with other models
This pipeline demonstrates a comprehensive approach to model development, incorporating various advanced AI training techniques and methodologies to achieve optimal performance at each stage.
This image represents the process of AI learning from each other, where larger models teach smaller ones, specialized models refine their expertise, and multiple AI systems collaborate to optimize and evolve together.
With Claude “A Framework for Value Analysis: From Single Value to Comprehensive Insights”
This diagram illustrates a sophisticated analytical framework that shows how a single value transforms through various analytical processes:
Time Series Analysis Path:
A single value evolves over time
Changes occur through two mechanisms:
Self-generated changes (By oneself)
External influence-driven changes (By influence)
These changes are quantified through a mathematical function f(x)
Statistical measures (average, minimum, maximum, standard deviation) capture the characteristics of these changes
Correlation Analysis Path:
The same value is analyzed for relationships with other relevant data
Weighted correlations indicate the strength and significance of relationships
These relationships are also expressed through a mathematical function f(x)
Integration and Machine Learning Stage:
Both analyses (time series and correlation) feed into advanced analytics
Machine Learning and Deep Learning algorithms process this dual-perspective data
The final output produces either a single generalized value or multiple meaningful values
Core Purpose: The framework aims to take a single value and:
Track its temporal evolution within a network of influences
Analyze its statistical behavior through mathematical functions
Identify weighted correlational relationships with other variables
Ultimately synthesize these insights through ML/DL algorithms to generate either a unified understanding or multiple meaningful outputs
This systematic approach demonstrates how a single data point can be transformed into comprehensive insights by considering both its temporal dynamics and relational context, ultimately leveraging advanced analytics for meaningful interpretation.
The framework’s strength lies in its ability to combine temporal patterns, relational insights, and advanced analytics into a cohesive analytical approach, providing a more complete understanding of how values evolve and relate within a complex system.