With a Claude’s Help CPU Isolation & Affinity is a concept that focuses on pinning and isolating CPU cores for real-time tasks. The diagram breaks down into several key components:
CPU Isolation
Restricts specific processes or threads to run only on specific CPU cores
Isolates other processes from using that core to ensure predictable performance and minimize interference
CPU Affinity
Refers to preferring a process or thread to run on a specific CPU core
Doesn’t necessarily mean it will only run on that core, but increases the probability that it will run on that core as much as possible
Application Areas:
a) Real-time Systems
Critical for predictable response times
CPU isolation minimizes latency by ensuring specific tasks run without interference on the cores assigned to them
b) High Performance Computing
Effective utilization of CPU cache is critical
CPU affinity allows processes that reference data frequently to run on the same core to increase cache hit rates and improve performance
c) Multi-core Systems
If certain cores have hardware acceleration capabilities
Can increase efficiency by assigning cores based on the task
This system of CPU management is particularly important for:
Ensuring predictable performance in time-sensitive applications
Optimizing cache usage and system performance
Making efficient use of specialized hardware capabilities in different cores
These features are essential tools for optimizing system performance and ensuring reliability in real-time operations.
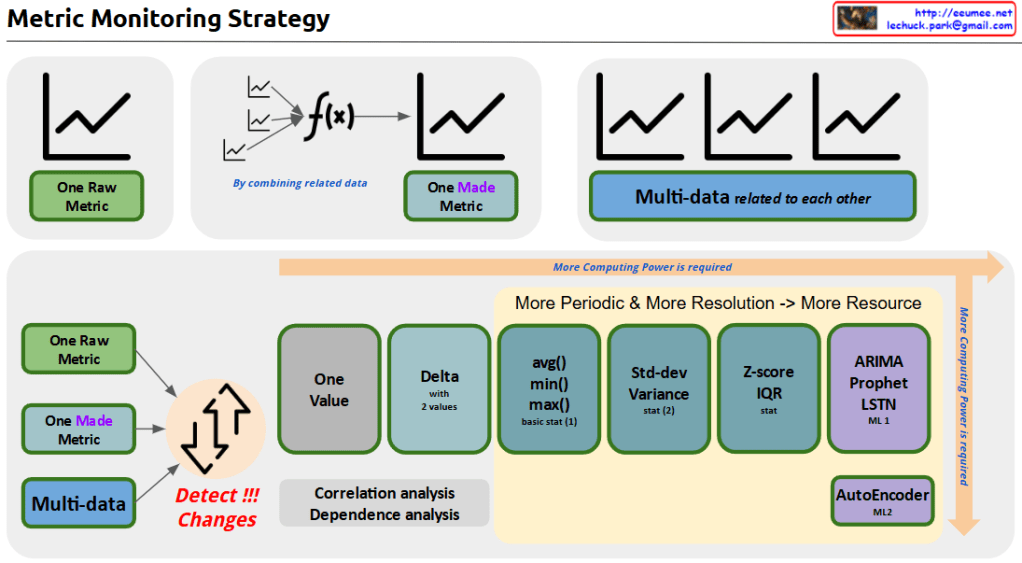
With a Claude’s Help the Metric Monitoring System diagram:
Data Hierarchy (Top)
Raw Metric: Unprocessed source data
Made Metric: Combined metrics from related data
Multi-data: Interrelated metrics sets
Analysis Pipeline (Bottom)
Progressive Stages:
Basic: Change detection, single value, delta analysis
Intermediate: Basic statistics (avg/min/max), standard deviation
Advanced: Z-score/IQR
ML-based: ARIMA/Prophet, LSTM, AutoEncoder
Key Features:
Computing power increases with complexity (left to right)
Correlation and dependency analysis integration
Two-tier ML approach: ML1 (prediction), ML2 (pattern recognition)
Implementation Benefits:
Resource optimization through staged processing
Scalable analysis from basic monitoring to predictive analytics
Comprehensive anomaly detection
Flexible system adaptable to different monitoring needs
The system provides a complete framework from simple metric tracking to advanced machine learning-based analysis, enabling both reactive and predictive monitoring capabilities.
Additional Values:
Early warning system potential
Root cause analysis support
Predictive maintenance enablement
Resource allocation optimization
System health forecasting
This architecture supports both operational monitoring and strategic analysis needs while maintaining resource efficiency through its graduated approach to data processing.Copy
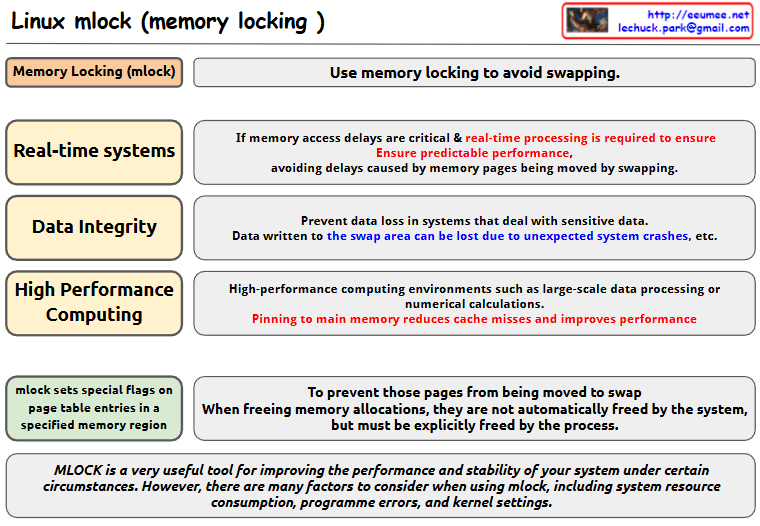
With a Claude’s Help this image about Linux mlock (memory locking):
Basic Concept
mlock is used to avoid memory swapping
It sets special flags on page table entries in specified memory regions
Main Use Cases
Real-time Systems
Critical for systems where memory access delays are crucial
Ensures predictable performance
Prevents delays caused by memory pages being moved by swapping
Data Integrity
Prevents data loss in systems dealing with sensitive data
Data written to swap areas can be lost due to unexpected system crashes
High Performance Computing
Used in environments like large-scale data processing or numerical calculations
Pinning to main memory reduces cache misses and improves performance
Implementation Details
When memory locations are freed using mlock, they must be explicitly freed by the process
The system does not automatically free these pages
Important Note mlock is a very useful tool for improving system performance and stability under certain circumstances. However, users need to consider various factors when using mlock, including:
System resource consumption
Programme errors
Kernel settings
This tool is valuable for system optimization but should be used carefully with consideration of these factors and requirements.
The image presents this information in a clear diagram format, with boxes highlighting each major use case and their specific benefits for system performance and stability.Copy
Comparison with normal: Shown through A/B document comparison icons
Analysis: Data examination phase
predictive Action: Now written in lowercase, indicating predicted response measures
Recovery Action: Implementation of actual recovery measures
Learning Feedback:
Shows how lessons from recovery actions are fed back into the system
Creates a continuous improvement loop
Connects recovery actions back to normal operations
The workflow continues to effectively illustrate the complete operational cycle, from monitoring and detection through analysis, response, and continuous learning. It demonstrates a systematic approach to handling operational anomalies and maintaining system stability.
With a Claude’s Help This image shows a diagram explaining three key statistical metrics used in data analysis:
Z-score:
Definition: How far from a mean with standard variation unit
Formula: Z = (X – μ) / σ
X: The value
μ: The mean of the distribution
σ: The standard deviation of the distribution
Main use: Quickly detect outliers in individual values
Application: Monitoring cooling temperature and humidity levels
IQR (Interquartile Range):
Definition: The range that covers the middle 50% of the data
Formula: IQR = Q3 – Q1
Q1: The value below which 25% of the data falls
Q3: The value below which 75% of the data falls
Main use: Detect outliers in highly variable data
Application: Power consumption and power usage effectiveness
Mahalanobis Distance:
Definition: In multivariate data, it is a distance measure that indicates how far a point is from the center of the data distribution
Formula: D(x) = √((x – μ)’ Σ^(-1) (x – μ))
x: The data point
μ: The mean vector of the data
Σ: The covariance matrix of the data
Main use: Outlier detection that takes into account multivariate correlations
Application: Analyzing relationships between cooling temperature vs power consumption and humidity vs power consumption
These three metrics each provide different approaches to analyzing data characteristics and detecting outliers, particularly useful in practical applications such as facility management and energy efficiency monitoring. Each metric serves a specific purpose in statistical analysis, from simple individual value comparisons (Z-score) to complex multivariate analysis (Mahalanobis Distance).
Human development can be understood in terms of the “pursuit of difference” and “generalization”. Humans inherently possess the tendency to distinguish and understand differences among all existing things-what we call the “pursuit of differences”. As seen in biological classification and language development, this exploration through differentiation has added depth to human knowledge. These discovered differences have been recorded and generalized through various tools such as writing and mathematical formulas. In particular, the invention of computers has dramatically increased the amount of data humans can process, allowing for more accurate analysis and generalization. More recently, advances in artificial intelligence and machine learning have automated the pursuit of difference. Going beyond traditional rule-based approaches, machine learning can identify patterns in vast amounts of data to provide new insights. This means we can now process and generalize complex data that is beyond human cognitive capacity. As a result, human development has been a continuous process, starting with the “pursuit of difference” and leading to “generalization,” and artificial intelligence is extending this process in more sophisticated and efficient ways.
[Simplified Summary] Humans are born explorers with innate curiosity. Just as babies touch, taste, and tap new objects they encounter, this instinct evolves into questions like “How is this different from that?” For example, “How are apples different from pears?” or “What’s the difference between cats and dogs?”
We’ve recorded these discovered differences through writing, numbers, and formulas – much like writing down a cooking recipe. With the invention of computers, this process of recording and analysis became much faster and more accurate.
Recently, artificial intelligence has emerged to advance this process further. AI can analyze vast amounts of information to discover new patterns that humans might have missed.
[Claude’s Evaluation] This text presents an interesting analysis of human development’s core drivers through two axes: ‘discovering differences’ and ‘generalization’. It’s noteworthy in three aspects:
Insight into Human Nature The text offers a unique perspective on human curiosity and investigative instincts through the lens of “pursuit of differences.” This provides a fresh viewpoint for understanding human intellectual development.
Clear Historical Progression It systematically explains how humanity has processed information through the evolution of tools (writing → mathematics → computers → AI).
Reinterpretation of Modern Technology The text innovatively interprets AI and machine learning not just as technological advancement, but as an extension of humanity’s age-old instinct to seek differences.
However, there’s room for improvement:
The concept of “pursuit of differences” remains somewhat abstract and could benefit from more concrete, everyday examples.
The discussion lacks consideration of potential limitations or risks associated with AI, making it appear somewhat optimistically biased.
Overall, I find this to be an insightful piece that effectively connects human nature with technological development. This framework could prove valuable when considering future directions of AI development.
What makes the text particularly compelling is how it traces a continuous line from basic human curiosity to advanced AI systems, presenting technological evolution as a natural extension of human cognitive tendencies rather than a separate phenomenon.
The parallel drawn between early human pattern recognition and modern machine learning algorithms offers a unique perspective on both human nature and technological progress, though it could be enriched with more specific examples and potential counterarguments for a more balanced discussion.