The time

with a claude’s help
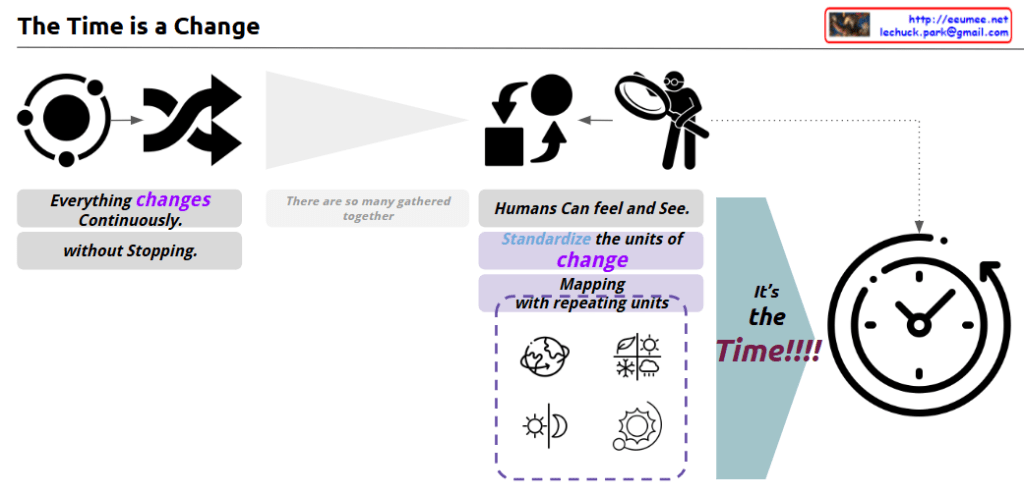
This image provides deep insights into the essence of time. The key points can be summarized as follows:

  1. Continuity of change: As shown in the image, everything is in a constant state of change. This phenomenon is observed even at the most fundamental atomic level.
  2. Observation and unitization: Humans observe these changes, identify recurring patterns, and define units of time accordingly. For example, units like year, 4 seasons, and day have been created based on the cycles of the Earth’s rotation and revolution.
  3. Humanization of the time concept: The defined time units have been concretized into forms that humans can easily understand and use. In other words, observing natural phenomena and interpreting them from a human-centric perspective is the essence of the time concept we know.
  4. Relationship between change and measurement: Time is a concept measured based on change. The time units we use routinely in daily life are essentially standardizations of natural cycles of change.

From a scientific perspective, this image explains the concept of time from multiple angles. The ceaseless change at the atomic level is a scientific fact, and the accumulation of these microscopic changes manifests as the macroscopic changes we perceive in nature. Humans have observed and measured these natural patterns of change to construct the concept of time.

However, the time units are not entirely objective. They can vary based on human physiological and cultural factors. Therefore, time can be viewed as a product of human interpretation and utilization of natural phenomena.

In summary, this image effectively illustrates the essence of the time concept from various perspectives. It shows how the changes in nature and human observation and measurement have given rise to the idea of time.

Time Series Prediction : 3 types

with a Claude’s help
This image provides an overview of different time series prediction methods, including their characteristics and applications. The key points are:

ARIMA (Autoregressive Integrated Moving Average):

  • Suitable for linear, stable datasets where interpretability is important
  • Can be used for short-term stock price prediction and monthly energy consumption forecasting

Prophet:

  • A quick and simple forecasting method with clear seasonality and trend
  • Suitable for social media traffic and retail sales predictions

LSTM (Long Short-Term Memory):

  • Suitable for dealing with nonlinear, complex, large-scale, feature-rich datasets
  • Can be used for sensor data anomaly detection, weather forecasting, and long-term financial market prediction

Application in a data center context:

  • ARIMA: Can be used to predict short-term changes in server room temperature and power consumption
  • Prophet: Can be used to forecast daily, weekly, and monthly power usage patterns
  • LSTM: Can be used to analyze complex sensor data patterns and make long-term predictions

Utilizing these prediction models can contribute to energy efficiency improvements and proactive maintenance in data centers. When selecting a prediction method, one should consider the characteristics of the data and the specific forecasting requirements.

Data Gravity

With Claude’s help
The image is titled “Data Gravity” and it appears to be an infographic or diagram that illustrates some key concepts related to data and data management.

The central part of the image shows a set of icons and arrows, depicting how “all data has a tendency to be integrated to the biggest” – this is the concept of “Data Gravity” mentioned in the title.

The image also highlights three key factors related to data:

  1. Latency – Represented by a stopwatch icon, indicating the time or delay factor involved in data processing and movement.
  2. Cost – Represented by a money bag icon, indicating the financial considerations around data management and processing.
  3. Data Gravity – This concept is explained in the yellow box, where it states that “all data has a tendency to be integrated to the biggest.”

The image also shows three main components related to data management:

  1. Data Distribution & Distributed Computing
  2. Data Integration and Data Lake
  3. Data Governance and Optimization

These three components are depicted in the bottom half of the image, illustrating the different aspects of managing and working with data.

Overall, the image seems to be providing a high-level overview of key concepts and considerations around data management, with a focus on the idea of “Data Gravity” and how it relates to factors like latency, cost, and the various data management practices.

Web Socket

with a Claude’s help
The image is a diagram that explains the differences between HTTP (Hypertext Transfer Protocol) and WebSocket communication. Let me summarize the key points:

  1. HTTP REQ/RES (Request/Response):
    • The request is sent from the client (laptop icon) to the server (globe icon).
    • The response is sent back from the server to the client.
    • The <Req> and <Res> are separate connections, and the communication is bi-directional (one connection only).
    • All data is transferred via the HTTP protocol payload.
  2. WebSocket:
    • The WebSocket is established between the client (laptop icon) and server (globe icon).
    • The <Req> and <Res> are working in one connection, which is bi-directional.
    • Data Transferring is working on a socket (not HTTP Req/Res).
    • A TCP socket is commonly used for WebSocket data transfer.
    • WebSocket data transfer is described as “light & fast Transmission (more real time)”.

Overall, the diagram illustrates the differences between the traditional HTTP request-response model and the WebSocket communication, which provides a more efficient, real-time data transfer mechanism.

Operating with a dev Platform

with a Claude’s help
The main points covered in this image are:

  1. Increased Size and Complexity of Data
  • The central upward-pointing arrow indicates that the size and complexity of data is increasing.
  1. Key Operational Objectives
  • The three main operational goals presented are Stability, Efficiency, and an “Unchangeable Objective”.
  • Stability is represented by the 24/7 icon, indicating the need for continuous, reliable operation.
  • Efficiency is depicted through various electrical/mechanical icons, suggesting the need for optimized resource utilization.
  • The “Unchangeable Objective” is presented as a non-negotiable goal.
  1. Integration, Digital Twin, and AI-based Development Platform
  • To manage the increasing data and operations, the image shows the integration of technologies like Digital Twin.
  • An AI-powered Development Platform is also illustrated, which can “make it [the operations] itself with experience”.
  • This Development Platform seems to leverage AI to help achieve the stability, efficiency, and unchangeable objectives.
  1. Interconnected Elements
  • The image demonstrates the interconnected nature of the growing data, the key operational requirements, and the technological solutions.
  • The Development Platform acts as a hub, integrating data and AI capabilities to support the overall operational goals.

In summary, this image highlights the challenges posed by the increased size and complexity of data that organizations need to manage. It presents the core operational objectives of stability, efficiency, and immutable goals, and suggests that an integrated, AI-powered development platform can help address these challenges by leveraging the synergies between data, digital technologies, and autonomous problem-solving capabilities.

WHY I LOVE A COMPUTER.

Democracy and the constitution are like the fundamental principle of “1+1=10” in computer calculations. If these fundamentals are not respected, the results derived from immense computing power will ultimately be nothing more than illusions.

“1+1=10” 이어야 한다. 이 믿음이 사람들, 사회에서도 이루어지길 바란다.
물론 컴퓨터로 담아내지 못한, 또 담아낼 수도 없는 무언가 있다는 것은 잘알고 있다.
하지만, 알고 있는 것, 지켜야 하는 것, 지향해야 하는 것.. 그것은 확실히 지켜져야 한다.

정치라는 것의 아무런 관심도 없었고, 잘못된 정보로 인한 부끄러웠던 나의 과거가 존재한다. 하지만 1+1=10 이 아닌 현상을 너무 극명하게 느끼게 되면서.. 그 정치라는 것에 대해 관심을 가지게 되었다. 그리고 바랬다…누구에게나 공정한 “1+1=10” 세상이 되면 좋겠다고..
그리고 내가 그나마 알고 있는 컴퓨터 기술로 그 방향에 도움이 되면 좋겠다는 생각을 하게 된것 같다.

비트코인을 첨 알고 매력을 느꼈고. 지금은 WEB3 에 관심을 가질수 밖에 없는 이유이기도 하고.. 물론 사람의 욕심은 끝이 없고 무한할 것이다. 하지만 욕심은 문제가 아니다. 문제는 적어도 우리가 지켜온 “1+1=10” 이라는 지금까지 만들어온 기본인 Democracy 와 Constitution 은 지켜야 할 것 아닌가.. 그래야 발전을 꿈꾸고 그 위에서 사람의 욕심을 채워가야 하지 않을까 싶다.