Korean BBQ (Sam Gyeop Sal)

Samgyeopsal is one of the most beloved dishes in Korean cuisine, known for its simplicity and rich flavors. It consists of thick, fatty slices of pork belly, which are grilled to perfection at the table. The dish is typically enjoyed with a variety of side dishes (banchan) like kimchi, garlic, and ssamjang (a thick, spicy paste). Often, the grilled meat is wrapped in fresh lettuce or perilla leaves along with rice and the chosen banchan to create a delicious and balanced bite. This communal style of eating makes samgyeopsal not only a meal but also a social experience, often accompanied by soju, a popular Korean distilled beverage.

“if then” by AI

From Claude with some prompting
This image titled “IF THEN” by AI illustrates the evolution from traditional programming to modern AI approaches:

  1. Upper section – “Programming”: This represents the traditional method. Here, programmers collect data, analyze it, and explicitly write “if-then” rules. This process is labeled “Making Rules”.
    • Data collection → Analysis → Setting conditions (IF) → Defining actions (THEN)
  2. Lower section – “AI”: This shows the modern AI approach. It uses “Huge Data” to automatically learn patterns through machine learning algorithms.
    • Large-scale data → Machine Learning → AI model generation

Key differences:

  • Traditional method: Programmers explicitly define rules
  • AI method: Automatically learns patterns from data to create AI models that include basic “if-then” logic

The image effectively diagrams the shift in programming paradigms. It demonstrates how AI can process and learn from massive datasets to automatically generate logic that was previously manually defined by programmers.

This visualization succinctly captures how AI has transformed the approach to problem-solving in computer science, moving from explicit rule-based programming to data-driven, pattern-recognizing models.

The infinite is in the hands

From Claude with some prompting
This image illustrates the profound concept of capturing infinity through a simple human-made equation, y = 2x. Here’s an updated interpretation:

  1. The title “Y=2x, The infinite is in the hands” suggests humanity’s ability to grasp and manipulate the concept of infinity.
  2. The large circular area on the left represents various instances of the equation, showing both finite and seemingly infinite cases (e.g., very large numbers, algebraic expressions).
  3. The arrow pointing to the right symbolizes the unification of all these cases into a single, elegant formula: y = 2x.
  4. The rectangle on the right, containing “y = 2x” with “include ∞”, represents how this human-created formula can encompass infinite possibilities.
  5. The infinity symbols (∞) scattered throughout the image emphasize the all-encompassing nature of this relationship.

The core message is one of wonder and potential:

  1. Wonder: It expresses amazement at how a simple, human-devised equation can capture and represent infinite cases and possibilities.
  2. Potential: It implies that by understanding and harnessing such powerful concepts, humans can use them as building blocks for further creativity and innovation.

This visualization celebrates human ingenuity in mathematics, showing how we can encapsulate the vastness of infinity within a concise formula. It suggests that by creating such tools to understand and work with infinity, we open doors to new realms of thought and creation.

The image invites viewers to appreciate the elegance of mathematics and to consider how such fundamental concepts can lead to further breakthroughs and applications across various fields of human endeavor.

Before & Optimization

From Claude with some prompting
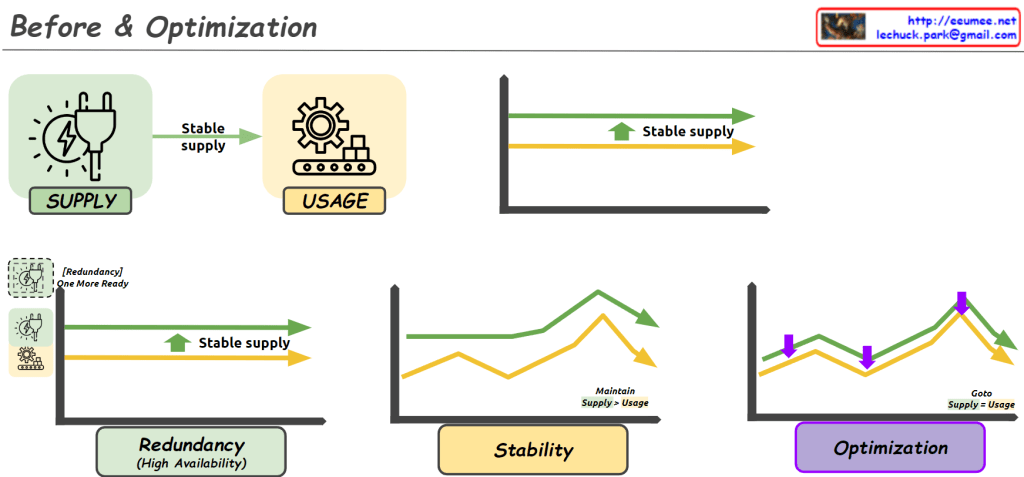
This image illustrates the process of “Before & Optimization” in a system, divided into three main stages:

  1. Initial State:
    • Shows “Supply” and “Usage” components.
    • Demonstrates a stable supply flowing to usage.
    • The graph indicates supply maintaining slightly above usage.
  2. Intermediate Stage:
    • Introduces “Redundancy (High Availability)”.
    • An additional supply unit labeled “One More Ready” is added.
    • The “Stability” graph shows supply consistently higher than usage, with the note “Maintain Supply > Usage”.
  3. Final Optimization Stage:
    • The “Optimization” graph shows supply and usage being closely aligned.
    • Purple arrows indicate adjustments to match supply with usage.
    • Labeled “Goto Supply = Usage”, showing the goal of matching supply to usage.

Overall, this image depicts the progression from ensuring stable supply, through adding redundancy for increased stability, to finally optimizing the system by matching supply closely with usage. It demonstrates the process of maintaining system stability while improving efficiency.

Automation System

From Claude with some prompting
This image illustrates an Automation process, consisting of two main parts:

  1. Upper section:
    • Shows a basic automation process consisting of Condition and Action.
    • Real Data (Input) and Real Plan (Output) are fed into a Software System.
  2. Lower section:
    • Depicts a more complex automation process.
    • Alternates between manual operations (hand holding hammer icon) and software systems (screen with gear icon).
    • This represents the integration of manual tasks and automated systems.
    • Key features of the process:
      • Use of Accurate Verified Data
      • 24/7 Stable System operation
      • Continuous Optimization
    • Results: More Efficient process with Cost & Resource reduction

The hammer icon represents manual interventions, working in tandem with automated software systems to enhance overall process efficiency. This approach aims to achieve optimal results by combining human involvement with automation systems.

The image demonstrates how automation integrates real-world tasks with software systems to increase efficiency and reduce costs and resources.