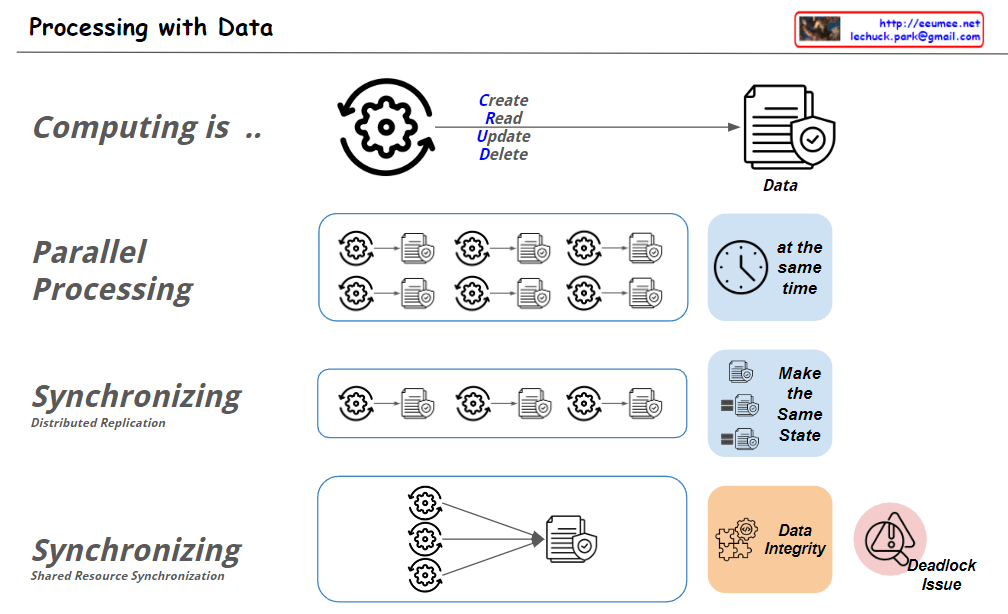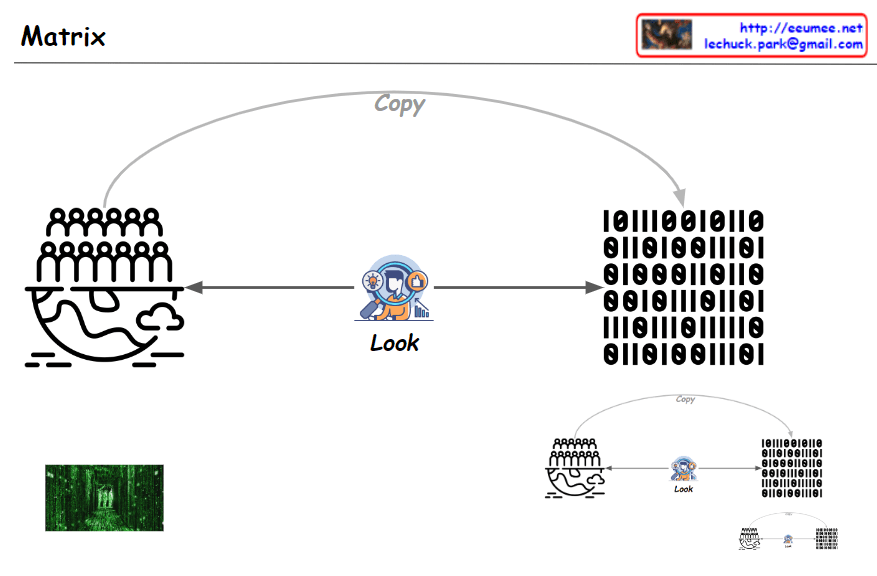
From Claude with some prompting
- Relationship between Reality and Digital World:
- The left image represents our real world.
- The numbers on the right show a virtual world created by computers.
- This illustrates the process of transferring our reality into a computer environment.
- Human Observation and Digital Replication:
- The central character symbolizes humans observing and studying the real world.
- The ‘Look’ label indicates humans closely examining reality.
- This represents human efforts to understand the real world and recreate it digitally.
- Endless Virtual Worlds:
- The smaller repetition of the image at the bottom is significant.
- It suggests that within a virtual world, another virtual world can be created.
- This shows the potential for an infinite loop of virtual realities.
- Technological Advancement:
- The ‘Copy’ arrow represents the process of transferring reality into digital form.
- It indicates the increasing digitization of everything around us.
- Significance of The Matrix Movie:
- The image implies that The Matrix film effectively illustrates the digitization process in modern society.
- The movie explores the idea that in the future, distinguishing between reality and the virtual world may become challenging.
- Points to Ponder:
- This image raises various questions about technological advancement.
- For instance, “What is true reality?” or “Can a computer-generated world become reality?”
This image demonstrates human attempts to observe and understand the real world, then transfer it into a digital realm. It connects to the concept of digital twins – digital replications of real-world entities. The image also suggests that this process can repeat and intensify indefinitely, presenting both the possibilities and challenges of technological advancement. Ultimately, it succinctly illustrates the increasing digitization of our society and the philosophical questions this trend raises.