From Claude with some prompting
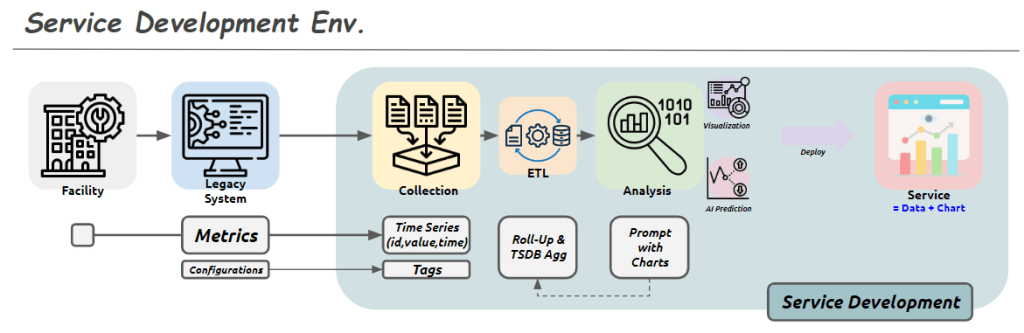
This image illustrates the data processing, analysis, and machine learning application process, emphasizing how errors can be amplified at each stage:
- Data Flow:
- Starts with RAW data.
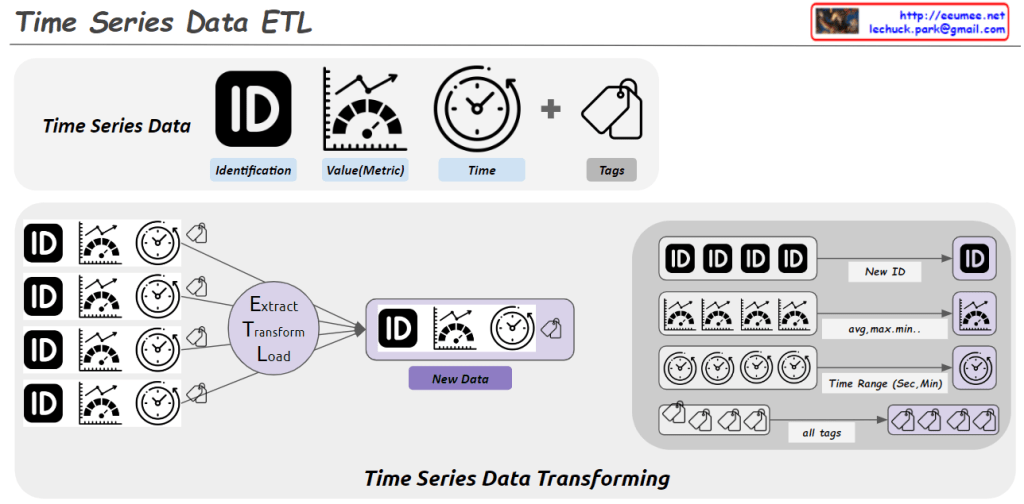
- Goes through multiple ETL (Extract, Transform, Load) processes, transforming into new forms of data (“NEW”) at each stage.
- Time information is incorporated, developing into statistical data.
- Finally, it’s processed through machine learning techniques, evolving into more sophisticated new data.
- Error Propagation and Amplification:
- Each ETL stage is marked with a “WHAT {IF.}” and a red X, indicating the possibility of errors.
- Errors occurring in early stages propagate through subsequent stages, with their impact growing progressively larger, as shown by the red arrows.
- The large red X at the end emphasizes how small initial errors can have a significant impact on the final result.
- Key Implications:
- As the data processing becomes more complex, the quality and accuracy of initial data become increasingly crucial.
- Thorough validation and preparation for potential errors at each stage are necessary.
- Particularly for data used in machine learning models, initial errors can be amplified, severely affecting model performance, thus requiring extra caution.
This image effectively conveys the importance of data quality management in data science and AI fields, and the need for systematic preparation against error propagation. It highlights that as data becomes more abstracted and processed, the potential impact of early errors grows, necessitating robust error mitigation strategies throughout the data pipeline.