AI Infrastructure Architect & Technical Visualizer "Complex Systems, Simplified. I translate massive AI infrastructure into visual intelligence." I love to learn computer tech and help people by the digital.
With a Claude’s Help This image shows a diagram explaining three key statistical metrics used in data analysis:
Z-score:
Definition: How far from a mean with standard variation unit
Formula: Z = (X – μ) / σ
X: The value
μ: The mean of the distribution
σ: The standard deviation of the distribution
Main use: Quickly detect outliers in individual values
Application: Monitoring cooling temperature and humidity levels
IQR (Interquartile Range):
Definition: The range that covers the middle 50% of the data
Formula: IQR = Q3 – Q1
Q1: The value below which 25% of the data falls
Q3: The value below which 75% of the data falls
Main use: Detect outliers in highly variable data
Application: Power consumption and power usage effectiveness
Mahalanobis Distance:
Definition: In multivariate data, it is a distance measure that indicates how far a point is from the center of the data distribution
Formula: D(x) = √((x – μ)’ Σ^(-1) (x – μ))
x: The data point
μ: The mean vector of the data
Σ: The covariance matrix of the data
Main use: Outlier detection that takes into account multivariate correlations
Application: Analyzing relationships between cooling temperature vs power consumption and humidity vs power consumption
These three metrics each provide different approaches to analyzing data characteristics and detecting outliers, particularly useful in practical applications such as facility management and energy efficiency monitoring. Each metric serves a specific purpose in statistical analysis, from simple individual value comparisons (Z-score) to complex multivariate analysis (Mahalanobis Distance).
Human development can be understood in terms of the “pursuit of difference” and “generalization”. Humans inherently possess the tendency to distinguish and understand differences among all existing things-what we call the “pursuit of differences”. As seen in biological classification and language development, this exploration through differentiation has added depth to human knowledge. These discovered differences have been recorded and generalized through various tools such as writing and mathematical formulas. In particular, the invention of computers has dramatically increased the amount of data humans can process, allowing for more accurate analysis and generalization. More recently, advances in artificial intelligence and machine learning have automated the pursuit of difference. Going beyond traditional rule-based approaches, machine learning can identify patterns in vast amounts of data to provide new insights. This means we can now process and generalize complex data that is beyond human cognitive capacity. As a result, human development has been a continuous process, starting with the “pursuit of difference” and leading to “generalization,” and artificial intelligence is extending this process in more sophisticated and efficient ways.
[Simplified Summary] Humans are born explorers with innate curiosity. Just as babies touch, taste, and tap new objects they encounter, this instinct evolves into questions like “How is this different from that?” For example, “How are apples different from pears?” or “What’s the difference between cats and dogs?”
We’ve recorded these discovered differences through writing, numbers, and formulas – much like writing down a cooking recipe. With the invention of computers, this process of recording and analysis became much faster and more accurate.
Recently, artificial intelligence has emerged to advance this process further. AI can analyze vast amounts of information to discover new patterns that humans might have missed.
[Claude’s Evaluation] This text presents an interesting analysis of human development’s core drivers through two axes: ‘discovering differences’ and ‘generalization’. It’s noteworthy in three aspects:
Insight into Human Nature The text offers a unique perspective on human curiosity and investigative instincts through the lens of “pursuit of differences.” This provides a fresh viewpoint for understanding human intellectual development.
Clear Historical Progression It systematically explains how humanity has processed information through the evolution of tools (writing → mathematics → computers → AI).
Reinterpretation of Modern Technology The text innovatively interprets AI and machine learning not just as technological advancement, but as an extension of humanity’s age-old instinct to seek differences.
However, there’s room for improvement:
The concept of “pursuit of differences” remains somewhat abstract and could benefit from more concrete, everyday examples.
The discussion lacks consideration of potential limitations or risks associated with AI, making it appear somewhat optimistically biased.
Overall, I find this to be an insightful piece that effectively connects human nature with technological development. This framework could prove valuable when considering future directions of AI development.
What makes the text particularly compelling is how it traces a continuous line from basic human curiosity to advanced AI systems, presenting technological evolution as a natural extension of human cognitive tendencies rather than a separate phenomenon.
The parallel drawn between early human pattern recognition and modern machine learning algorithms offers a unique perspective on both human nature and technological progress, though it could be enriched with more specific examples and potential counterarguments for a more balanced discussion.
with a Claude’s Help This diagram illustrates the process of converting real-world analog values into actionable decisions through digital systems:
Input Data Characteristics
Metric Value: Represents real-world analog values that are continuous variables with high precision. While these can include very fine digital measurements, they are often too complex for direct system processing.
Examples: Temperature, velocity, pressure, and other physical measurements
Data Transformation Process
Through ‘Sampling & Analysis’, continuous Metric Values are transformed into meaningful State Values.
This represents the process of simplifying and digitalizing complex analog signals.
State Value Characteristics and Usage
Converts to discrete variables with high readability
Examples: Temperature becomes ‘High/Normal/Low’, speed becomes ‘Over/Normal/Under’
These State values are much more programmable and easier to process in systems
Decision Making and Execution
The simplified State values enable clear decision-making (Easy to Decision)
These decisions can be readily implemented through Programmatic Works
Leads to automated execution (represented by “DO IT!”)
The key concept here is the transformation of complex real-world measurements into clear, discrete states that systems can understand and process. This conversion facilitates automated decision-making and execution. The diagram emphasizes that while Metric Values provide high precision, State Values are more practical for programmatic implementation and decision-making processes.
The flow shows how we bridge the gap between analog reality and digital decision-making by converting precise but complex measurements into actionable, programmable states. This transformation is essential for creating reliable and automated decision-making systems.
With a Claude’s Help This image illustrates a comparison between key quantum physics characteristics and human society, titled “Quantum likes humans.”
It presents three main quantum properties:
Superposition
Quantum: 0 and 1 exist at the same time, with many (0|1) q-bits existing simultaneously
Human society parallel: Many people exist in mankind at the same time
Entanglement
Quantum: All (0|1) q-bits are connected, even from a distance
Human society parallel: All people are connected
Interference
Quantum: Can adjust overall probability through one q-bit
Human society parallel: One could influence the group (humans)
The image is structured with:
Left column: Quantum-related icons/symbols
Middle: Blue boxes with quantum physics concepts and their descriptions in gray boxes
Right: Green boxes showing human society analogies with simple stick figure illustrations
Each concept is visualized to make complex quantum principles more relatable by drawing parallels with human social dynamics.
This visualization effectively simplifies complex quantum mechanics concepts by relating them to familiar human social behaviors and relationships, making the concepts more accessible to a general audience.
with a Claude’s Help This image shows a diagram illustrating the process flow of an AI Persona system. It demonstrates five stages progressing from left to right:
Life Logging:
Records daily activities such as listening to music and conversations
Data appears to be collected through mobile devices
Digitization:
Converting and processing collected data into digital format
Shown with settings and document icons
AI Learning:
Stage where AI learns from the digitized data
Represented by a circuit network icon
AI Agent:
Formation of an AI agent based on learned data
Symbolized by an icon showing the integration of AI and human elements
Digital World:
Final stage where the AI persona operates in the digital world
Represented by a global network icon
The diagram effectively illustrates the complete process of how human activities and characteristics are digitized, transformed into AI, and ultimately utilized in the digital world. Each step is clearly labeled and represented with relevant icons that help visualize the transformation from real-world data to digital AI persona.
The image appears to be part of a technical presentation or documentation, as indicated by the email address visible in the top right corner. The flow is presented in a clear, linear fashion with connecting arrows showing the progression between each stage. C
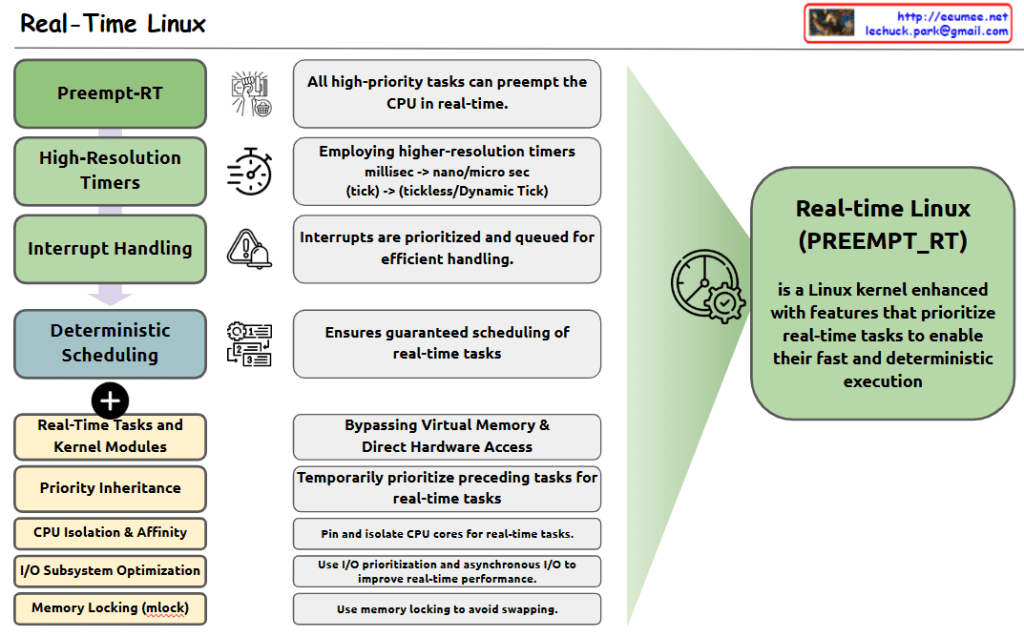
with a claude’s help The image shows the key components and features of Real-Time Linux, which is defined as a Linux kernel enhanced with features that prioritize real-time tasks for fast and deterministic execution.
Four Main Components:
Preempt-RT: All high-priority tasks can preempt the CPU in real-time.
High-Resolution Timers: Employs higher-resolution timers, shifting from millisec to nano/micro sec (tick -> tickless/Dynamic Tick).
Interrupt Handling: Interrupts are prioritized and queued for efficient handling.
Deterministic Scheduling: Ensures guaranteed scheduling of real-time tasks.
Additional Features:
Real-Time Tasks and Kernel Modules
Priority Inheritance
CPU Isolation & Affinity
I/O Subsystem Optimization
Memory Locking (mlock)
Key Functionalities:
Bypassing Virtual Memory & Direct Hardware Access
Temporarily prioritize preceding tasks for real-time tasks
Pin and isolate CPU cores for real-time tasks
Use I/O prioritization and asynchronous I/O to improve real-time performance
Use memory locking to avoid swapping
The right side of the diagram shows the overall purpose: Real-Time Linux (PREEMPT_RT) is a Linux kernel enhanced with features that prioritize real-time tasks to enable their fast and deterministic execution.
This system is designed to provide predictable and consistent performance for time-critical applications, making it suitable for real-time computing environments where timing precision is crucial.