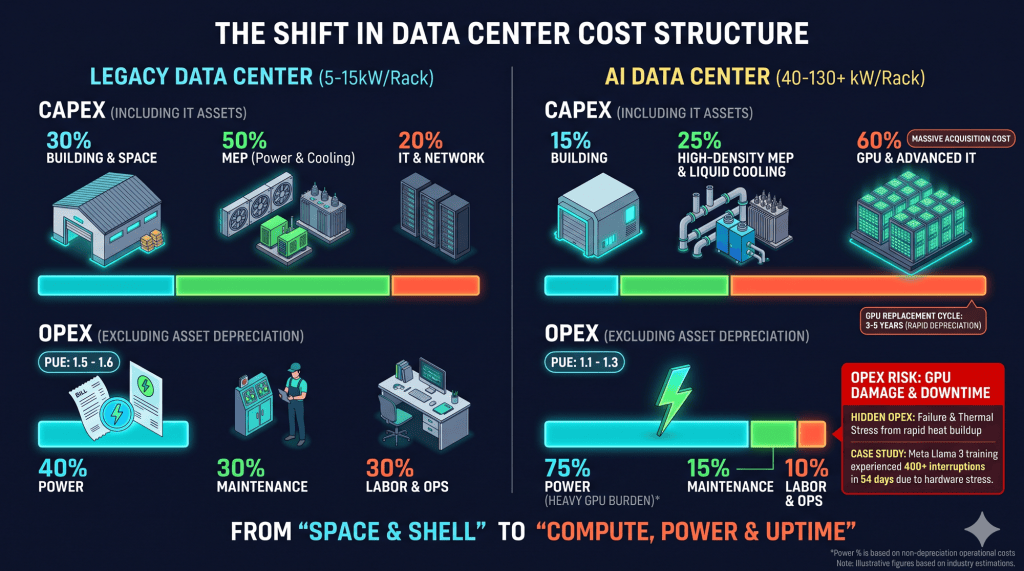
This infographic, titled “THE SHIFT IN DATA CENTER COST STRUCTURE,” compares the financial and operational profiles of Legacy Data Centers on the left with next-generation AI Data Centers on the right, showcasing the transition from traditional real estate environments to high-density, compute-heavy systems.
Detailed Visualization Analysis
1. Legacy Data Center (5–15kW/Rack) — Left Column
The legacy profile illustrates a traditional, real-estate-anchored model characterized by moderate energy needs and lower rack densities.
- CAPEX (including IT Assets): The capital investment is heavily tied up in infrastructure. Building & Space accounts for 30%. MEP (Power & Cooling) is the largest chunk at 50%, shown via industrial air conditioning units and basic transformer equipment. IT & Network is relatively modest at 20%.
- OPEX (excluding Asset Depreciation): Operating expenses are fairly balanced under a standard efficiency level of PUE 1.5–1.6. Power represents 40%, accompanied by stable and evenly distributed requirements for Maintenance (30%) and Labor & Ops (30%). This reflects a steady, predictable environment where space and housing are the primary considerations.
2. AI Data Center (40–130+ kW/Rack) — Right Column
The AI-optimized profile illustrates an incredibly dense, capital-intensive model dominated by advanced compute power and thermal risk.
- CAPEX (including IT Assets): The footprint for Building shrinks drastically to 15%, but the core spend flips. GPU & Advanced IT takes over a massive 60% of the CAPEX, highlighted with a “MASSIVE ACQUISITION COST” indicator. Beneath it, a red highlight highlights a 3–5 Years (Rapid Depreciation) GPU replacement cycle, a highly demanding capital reinvestment burden. To support this, High-Density MEP & Liquid Cooling rises to 25%, depicted by complex piping, liquid cooling loops, and sub-stations.
- OPEX (excluding Asset Depreciation): Operational costs are driven by extremely high rack density, despite a highly efficient PUE 1.1–1.3. Power now dominates the operating budget at 75%, labeled as a “HEAVY GPU BURDEN”. Because of the lower footprint, Maintenance drops to 15% and Labor & Ops to 10%.
- Red Highlights (The Risks): The right side introduces crucial risk metrics. The orange and red “OPEX RISK: GPU DAMAGE & DOWNTIME” highlight identifies Hidden OPEX arising from thermal and power stress. Under this, it lists a real-world case study: “Meta Llama 3 training experienced 400+ interruptions in 54 days due to hardware stress,” highlighting that keeping expensive processors active and cool is the paramount operational challenge.
3. Paradigm Shift (Bottom Footer)
The bottom horizontal arrow highlights the core evolutionary theme: the industry has shifted away From “Space & Shell” (providing room and basic utility services) To “Compute, Power & Uptime” (managing dense, high-heat compute assets and assuring continuous, zero-failure operations).
Summary
The image demonstrates that AI Data Centers have fundamentally shifted from a physical real-estate play to an extreme compute-and-power equation. CAPEX is heavily front-loaded into high-cost GPU systems that deprecate rapidly (3–5 years), backed by specialized liquid cooling. Meanwhile, OPEX is overwhelmingly consumed by electricity (75%) and the acute, invisible threat of downtime. In this new landscape, maintaining continuous “Uptime” and mitigating thermal/power stress is no longer just a facility maintenance checklist—it is the ultimate driver of ROI.
#AIDataCenter #DataCenterEconomics #CAPEXvsOPEX #GPUInfrastructure #LiquidCooling #PUEEfficiency #ComputePowerUptime #TCOOptimization #DataCenterRisk


The 3 to 5 year replacement cycle is the line I’d stress-test, because at least one operator argues for longer. On Amazon’s Q3 call, Andy Jassy said chips kept inside AWS drive more revenue and free cash flow “because you get to use them over five to six years”, and that after the Graviton 5 launch “backlog for prior generation Graviton instances still more than doubled quarter over quarter”, with prior-generation training capacity selling at a premium. If older accelerators keep earning, the depreciation burden in the right column is lighter than the infographic suggests; if they don’t, it is heavier. The transcript, for the exact wording: https://equibles.com/stocks/amzn/calls/2026-q3
Data: Amazon earnings call transcript, processed by Equibles.
LikeLike