Monitoring is from changes

Change-Based Monitoring System Analysis

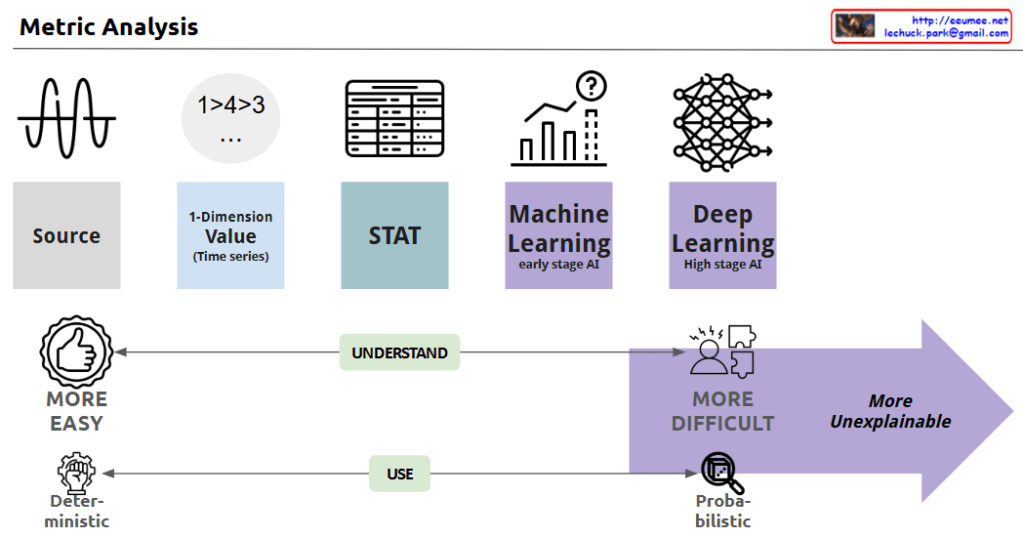
This diagram illustrates a systematic framework for “Monitoring is from changes.” The approach demonstrates a hierarchical structure that begins with simple, certain methods and progresses toward increasingly complex analytical techniques.

Flow of Major Analysis Stages:

  1. One Change Detection:
    • The most fundamental level, identifying simple fluctuations such as numerical changes (5→7).
    • This stage focuses on capturing immediate and clear variations.
  2. Trend Analysis:
    • Recognizes data patterns over time.
    • Moves beyond single changes to understand the directionality and flow of data.
  3. Statistical Analysis:
    • Employs deeper mathematical approaches to interpret data.
    • Utilizes means, variances, correlations, and other statistical measures to derive meaning.
  4. Deep Learning:
    • The most sophisticated analysis stage, using advanced algorithms to discover hidden patterns.
    • Capable of learning complex relationships from large volumes of data.

Evolution Flow of Detection Processes:

  1. Change Detection:
    • The initial stage of detecting basic changes occurring in the system.
    • Identifies numerical variations that deviate from baseline values (e.g., 5→7).
    • Change detection serves as the starting point for the monitoring process and forms the foundation for more complex analyses.
  2. Anomaly Detection:
    • A more advanced form than change detection, identifying abnormal data points that deviate from general patterns or expected ranges.
    • Illustrated in the diagram with a warning icon, representing early signs of potential issues.
    • Utilizes statistical analysis and trend data to detect phenomena outside the normal range.
  3. Abnormal (Error) Detection:
    • The most severe level of detection, identifying actual errors or failures within the system.
    • Shown in the diagram with an X mark, signifying critical issues requiring immediate action.
    • May be classified as a failure when anomaly detection persists or exceeds thresholds.

Supporting Functions:

  • Adding New Relative Data: Continuously collecting relevant data to improve analytical accuracy.
  • Higher Resolution: Utilizing more granular data to enhance analytical precision.

This framework demonstrates a logical progression from simple and certain to gradually more complex analyses. The hierarchical structure of the detection process—from change detection through anomaly detection to error detection—shows how monitoring systems identify and respond to increasingly serious issues.

With Claude

Analysis Evolutions and ..

With Claude
this image that shows the evolution of data analysis and its characteristics at each stage:

Analysis Evolution:

  1. 1-D (One Dimensional): Current Status analysis
  2. Time Series: Analysis of changes over time
  3. n-D Statistics: Multi-dimensional correlation analysis
  4. ML/DL (Machine Learning/Deep Learning): Huge-dimensional analysis including exceptions

Bottom Indicators’ Changes:

  1. Data/Computing/Complexity:
  • Marked as “Up and Up” and increases “Dramatically” towards the right
  1. Accuracy:
  • Left: “100% with no other external conditions”
  • Right: “not 100%, up to 99.99% from all data”
  1. Comprehensibility:
  • Left: “Understandable/Explainable”
  • Right: “Unexplainable”
  1. Actionability:
  • Left: “Easy to Action”
  • Right: “Difficult to Action require EXP” (requires expertise)

This diagram illustrates the trade-offs in the evolution of data analysis. As analysis methods progress from simple one-dimensional analysis to complex ML/DL, while the sophistication and complexity of analysis increase, there’s a decrease in comprehensibility and ease of implementation. It shows how more advanced analysis techniques, while powerful, require greater expertise and may be less transparent in their decision-making processes.

The progression also demonstrates how modern analysis methods can handle increasingly complex data but at the cost of reduced explainability and the need for specialized knowledge to implement them effectively.

One Value to Value(s)

With Claude
“A Framework for Value Analysis: From Single Value to Comprehensive Insights”

This diagram illustrates a sophisticated analytical framework that shows how a single value transforms through various analytical processes:

  1. Time Series Analysis Path:
    • A single value evolves over time
    • Changes occur through two mechanisms:
      • Self-generated changes (By oneself)
      • External influence-driven changes (By influence)
    • These changes are quantified through a mathematical function f(x)
    • Statistical measures (average, minimum, maximum, standard deviation) capture the characteristics of these changes
  2. Correlation Analysis Path:
    • The same value is analyzed for relationships with other relevant data
    • Weighted correlations indicate the strength and significance of relationships
    • These relationships are also expressed through a mathematical function f(x)
  3. Integration and Machine Learning Stage:
    • Both analyses (time series and correlation) feed into advanced analytics
    • Machine Learning and Deep Learning algorithms process this dual-perspective data
    • The final output produces either a single generalized value or multiple meaningful values

Core Purpose: The framework aims to take a single value and:

  • Track its temporal evolution within a network of influences
  • Analyze its statistical behavior through mathematical functions
  • Identify weighted correlational relationships with other variables
  • Ultimately synthesize these insights through ML/DL algorithms to generate either a unified understanding or multiple meaningful outputs

This systematic approach demonstrates how a single data point can be transformed into comprehensive insights by considering both its temporal dynamics and relational context, ultimately leveraging advanced analytics for meaningful interpretation.

The framework’s strength lies in its ability to combine temporal patterns, relational insights, and advanced analytics into a cohesive analytical approach, providing a more complete understanding of how values evolve and relate within a complex system.

Metric Analysis

With a Claude
This image depicts the evolution of data analysis techniques, from simple time series analysis to increasingly sophisticated statistical methods, machine learning, and deep learning.

As the analysis approaches become more advanced, the process becomes less transparent and the results more difficult to explain. Simple techniques are more easily understood and allow for deterministic decision-making. But as the analysis moves towards statistics, machine learning, and AI, the computations become more opaque, leading to probabilistic rather than definitive conclusions. This trade-off between complexity and explainability is the key theme illustrated.

In summary, the progression shows how data analysis methods grow more powerful yet less interpretable, requiring a balance between the depth of insights and the ability to understand and reliably apply the results.

From Data

From Claude with some prompting
following the overall sequence from data collection to AI systems development.

  1. Data Collection and Processing (Upper “From Data” section): a) Collecting data from people worldwide b) “Get Data”: Acquiring raw data c) “Gathering Data”: Converting data into binary format d) “Statistics Analysis”: Performing data analysis e) “Making Rules/Formula”: Generating rules or formulas based on analysis
  2. Evolution of AI Systems (Lower “Human-made AI (Legacy)” section): a) Human-centered analysis:
    • “Combine formulas”: Combining rules and formulas directly created by humans
    b) Machine Learning-based analysis:
    • Rule-based Machine Learning: • Utilizes Big Data • Generates rules/formulas through machine learning • Results evaluated as “True or False”
    • Statistical Machine Learning (e.g., LLM): • Utilizes Big Data • Performs statistical analysis using advanced machine learning • Results evaluated as “Better or Worse”

Key Points Summary:

  1. Data Processing Flow: Illustrates the step-by-step process from raw data collection to rule/formula generation.
  2. AI System Evolution:
    • Begins with human-centered rule-based systems
    • Progresses to machine learning models that learn rules from data
    • Advances to sophisticated statistical models (like LLMs) that recognize complex patterns and provide nuanced results
  3. Shift in Result Interpretation:
    • Moves from simple true/false outcomes
    • To relative and context-dependent “better/worse” evaluations

This image effectively demonstrates the progression of data processing and AI technology, particularly highlighting how AI systems have become more complex and sophisticated. It shows the transition from human-derived rules to data-driven machine learning approaches, culminating in advanced statistical models that can handle nuanced analysis and produce more contextualized results.

More abstracted Data & Bigger Error possibility

From Claude with some prompting
This image illustrates the data processing, analysis, and machine learning application process, emphasizing how errors can be amplified at each stage:

  1. Data Flow:
    • Starts with RAW data.
    • Goes through multiple ETL (Extract, Transform, Load) processes, transforming into new forms of data (“NEW”) at each stage.
    • Time information is incorporated, developing into statistical data.
    • Finally, it’s processed through machine learning techniques, evolving into more sophisticated new data.
  2. Error Propagation and Amplification:
    • Each ETL stage is marked with a “WHAT {IF.}” and a red X, indicating the possibility of errors.
    • Errors occurring in early stages propagate through subsequent stages, with their impact growing progressively larger, as shown by the red arrows.
    • The large red X at the end emphasizes how small initial errors can have a significant impact on the final result.
  3. Key Implications:
    • As the data processing becomes more complex, the quality and accuracy of initial data become increasingly crucial.
    • Thorough validation and preparation for potential errors at each stage are necessary.
    • Particularly for data used in machine learning models, initial errors can be amplified, severely affecting model performance, thus requiring extra caution.

This image effectively conveys the importance of data quality management in data science and AI fields, and the need for systematic preparation against error propagation. It highlights that as data becomes more abstracted and processed, the potential impact of early errors grows, necessitating robust error mitigation strategies throughout the data pipeline.

Statistics ?

From DALL-E with some prompting
The image presents an exploration of perspectives in the context of big data and AI. “Subjective” reflects personal perception, while “Objective” shows a fact-based approach, though limited. “Statistics” introduces a big data-based AI perspective, offering a nearly complete yet unlimited framework for interpretation and judgment. This new perspective highlights the need for fresh terminology and concepts to navigate the advanced analytical landscape shaped by AI, suggesting an evolution from traditional subjective and objective paradigms to a more nuanced, data-centric approach.