with a Claude’s Help
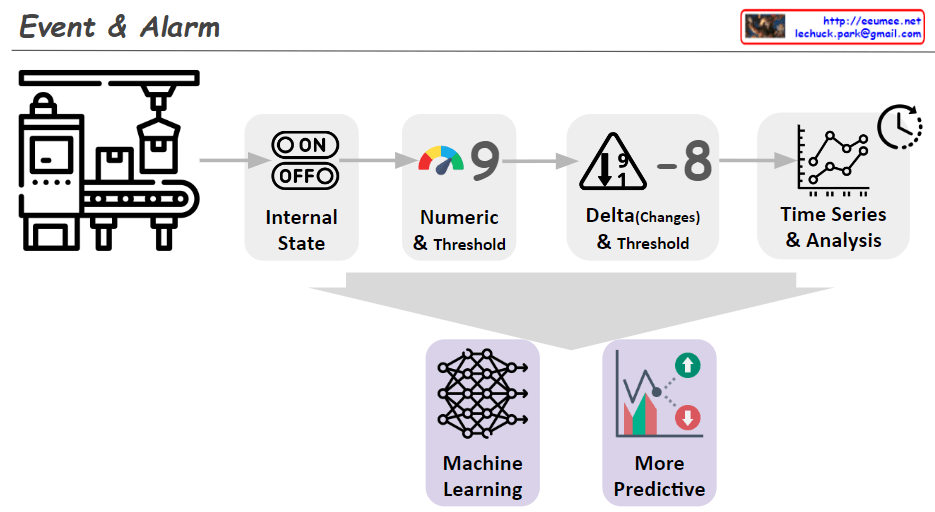
This diagram illustrates the process of converting real-world analog values into actionable decisions through digital systems:
- Input Data Characteristics
- Metric Value: Represents real-world analog values that are continuous variables with high precision. While these can include very fine digital measurements, they are often too complex for direct system processing.
- Examples: Temperature, velocity, pressure, and other physical measurements
- Data Transformation Process
- Through ‘Sampling & Analysis’, continuous Metric Values are transformed into meaningful State Values.
- This represents the process of simplifying and digitalizing complex analog signals.
- State Value Characteristics and Usage
- Converts to discrete variables with high readability
- Examples: Temperature becomes ‘High/Normal/Low’, speed becomes ‘Over/Normal/Under’
- These State values are much more programmable and easier to process in systems
- Decision Making and Execution
- The simplified State values enable clear decision-making (Easy to Decision)
- These decisions can be readily implemented through Programmatic Works
- Leads to automated execution (represented by “DO IT!”)
The key concept here is the transformation of complex real-world measurements into clear, discrete states that systems can understand and process. This conversion facilitates automated decision-making and execution. The diagram emphasizes that while Metric Values provide high precision, State Values are more practical for programmatic implementation and decision-making processes.
The flow shows how we bridge the gap between analog reality and digital decision-making by converting precise but complex measurements into actionable, programmable states. This transformation is essential for creating reliable and automated decision-making systems.