Getting server data

From Claude with some prompting
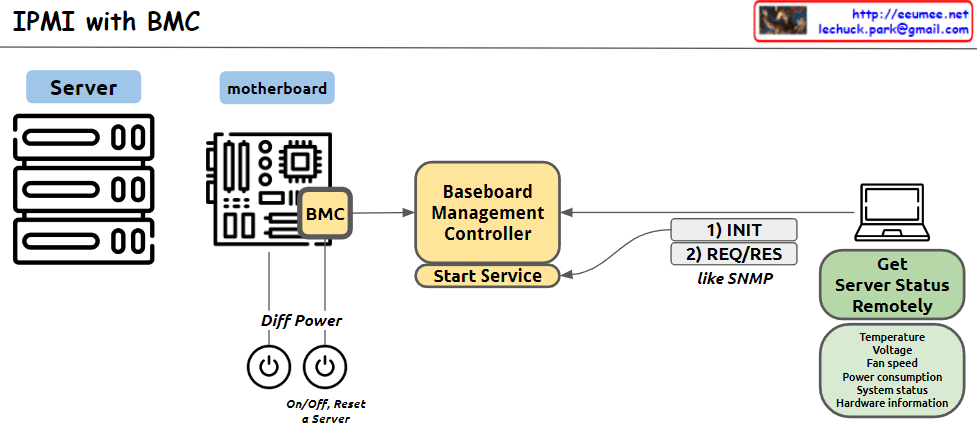
This image illustrates the structure of an IPMI (Intelligent Platform Management Interface) system using BMC (Baseboard Management Controller). The main components and functions are as follows:

  1. Server: Represents the managed server.
  2. Motherboard: Depicts the server’s mainboard, where the BMC chip is located.
  3. BMC (Baseboard Management Controller): The core component for monitoring and managing server hardware.
  4. Baseboard Management Controller: Performs the main functions of the BMC, with a “Start Service” function indicated.
  5. Diff Power: Represents the server’s power management functions, including On/Off and Reset capabilities.
  6. Remote management computer: Used to remotely monitor and manage the server status.
  7. Get Server Status Remotely: Server status information that can be checked remotely, including temperature, voltage, fan speed, power consumption, system status, and hardware information.
  8. Communication process: The interaction between the remote computer and BMC is shown to involve 1) INIT (initialization) and 2) REQ/RES (request/response) stages, described as functioning similar to SNMP.

This system allows administrators to remotely monitor and control the physical state of the server.

For the Same Traffic metering

From Claude with some prompting
“For the Same Traffic Metering” – Key Points:

  1. Problem: Different collection servers using SNMP may not yield the same results for identical traffic.
  2. Main causes of discrepancy:
    • Network equipment updates traffic information periodically.
    • To get consistent values, SNMP requests must align with the equipment’s update cycle.
    • Difficult to synchronize requests precisely across multiple servers.
  3. Challenges for resolution:
    • Servers need accurate time synchronization.
    • All requests should occur within the same ‘Update Cycle’ of the equipment.
  4. Time synchronization:
    • NTP can partially solve the issue.
    • Perfect (100%) synchronization is not achievable in practice.
  5. Consequence: SNMP data collected from multiple servers may show different results for the same traffic.
  6. Key insight: The image emphasizes the difficulties in accurate data collection using SNMP in network monitoring systems.
  7. Implications: Network administrators and system designers must be aware of these limitations and consider them when collecting and interpreting data.

This summary highlights the complexities involved in ensuring consistent traffic metering across multiple collection points in a network environment.

Anomaly Traffic Detection#1

From DALL-E with some prompting
The flowchart illustrates a four-step network anomaly detection process:

  1. Data Collection: Gather various types of network data.
  2. Protocol Usage: Employ SNMP, SFLOW/NETFLOW, and other methods to extract the data.
  3. Analysis: Analyze Ethernet and TCP/IP header data for irregularities.
  4. Control: Implement countermeasures like blocking traffic or controlling specific IP addresses.

The expected benefits of this process include enhanced network security through early detection of anomalies, the ability to prevent potential breaches by blocking suspicious traffic, and improved network management via real-time analysis and control.