from DALL-E with some prompting
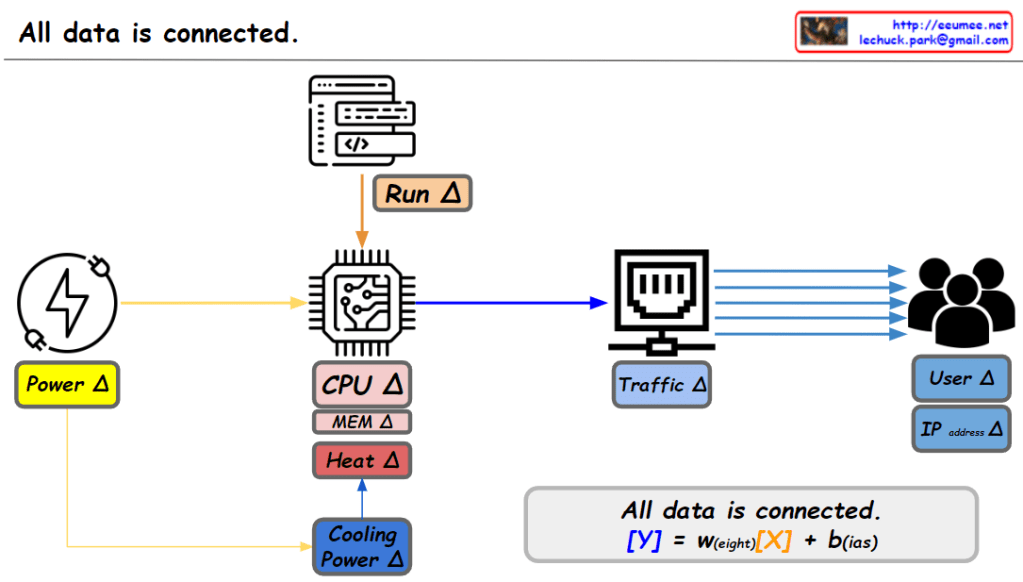
This image illustrates that key metrics generated from computing activities (such as power, CPU performance, memory usage, heat, and cooling power), data traffic, and user behavior (e.g., IP addresses) are interconnected. These metrics influence one another and their interactions can provide insights into the overall state of the system. The linear regression equation at the bottom of the image represents a simple mathematical model for analyzing and predicting the relationships between these metrics, suggesting how they can be numerically understood and connected.
