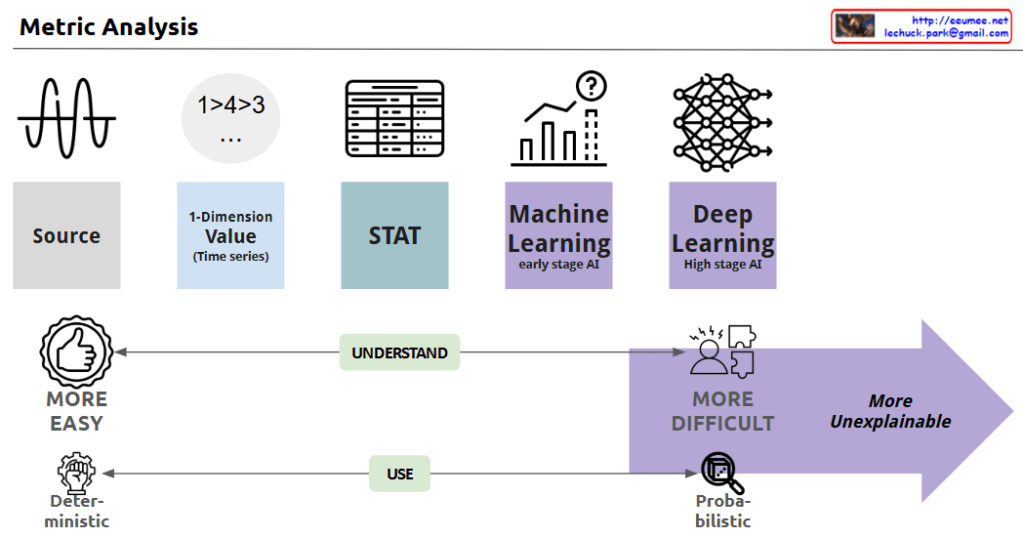
With a Claude This image depicts the evolution of data analysis techniques, from simple time series analysis to increasingly sophisticated statistical methods, machine learning, and deep learning.
As the analysis approaches become more advanced, the process becomes less transparent and the results more difficult to explain. Simple techniques are more easily understood and allow for deterministic decision-making. But as the analysis moves towards statistics, machine learning, and AI, the computations become more opaque, leading to probabilistic rather than definitive conclusions. This trade-off between complexity and explainability is the key theme illustrated.
In summary, the progression shows how data analysis methods grow more powerful yet less interpretable, requiring a balance between the depth of insights and the ability to understand and reliably apply the results.
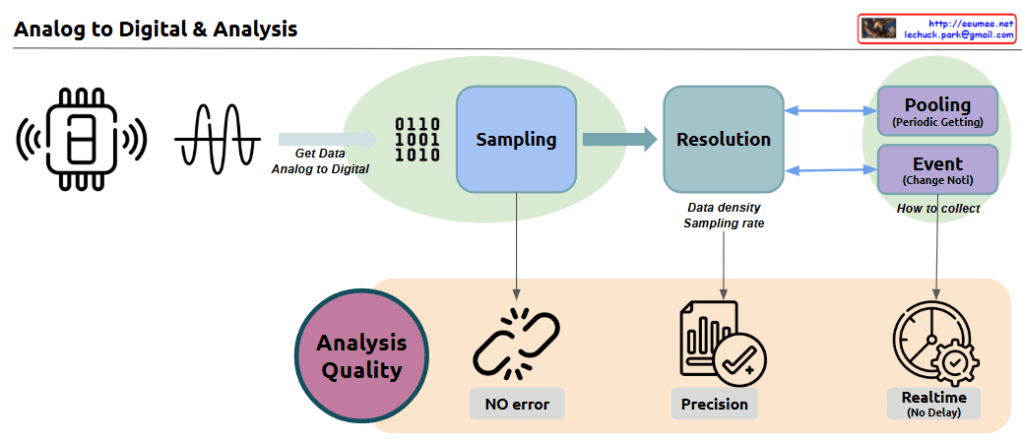
Comprehensive quality control throughout the process
Key Importance in Data Collection/Analysis:
Accuracy: Essential for reliable data-driven decision making. The quality of input data directly affects the validity of results and conclusions.
Real-time Processing: Critical for immediate response and monitoring, enabling quick decisions and timely interventions when needed.
Efficiency: Proper selection of collection methods ensures optimal resource utilization and cost-effective data management.
Quality Control: Consistent quality maintenance throughout the entire process determines the reliability of analytical results.
These elements work together to enable reliable data-driven decision-making and analysis. The success of any data analysis system depends on the careful implementation and monitoring of each component, from initial sampling to final analysis. When properly integrated, these components create a robust framework for accurate, efficient, and reliable data processing and analysis.
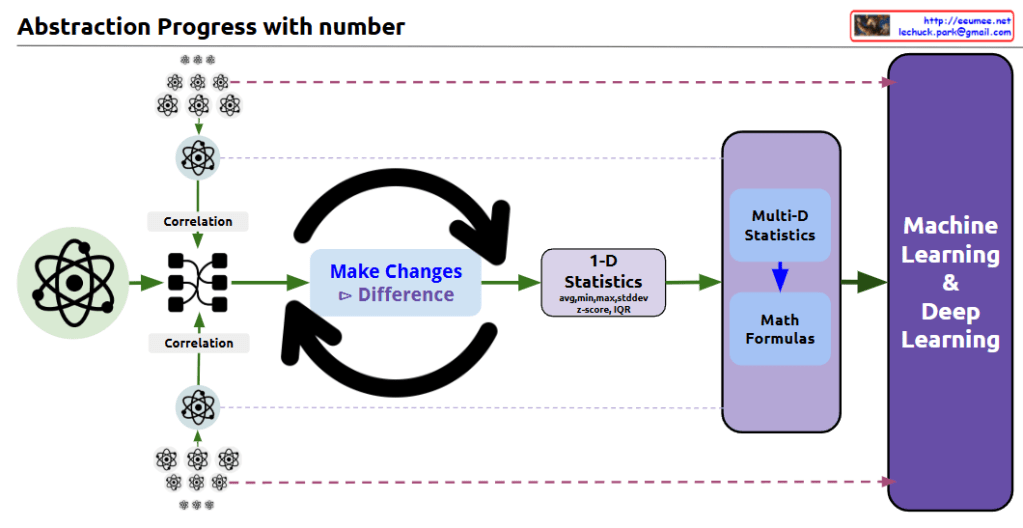
With Claude this diagram shows the progression of data abstraction leading to machine learning:
The process begins with atomic/molecular scientific symbols, representing raw data points.
The first step shows ‘Correlation’ analysis, where relationships between multiple data points are mapped and connected.
In the center, there’s a circular arrow system labeled ‘Make Changes’ and ‘Difference’, indicating the process of analyzing changes and differences in the data.
This leads to ‘1-D Statistics’, where basic statistical measures are calculated, including:
Average
Median
Standard deviation
Z-score
IQR (Interquartile Range)
The next stage incorporates ‘Multi-D Statistics’ and ‘Math Formulas’, representing more complex statistical analysis.
Finally, everything culminates in ‘Machine Learning & Deep Learning’.
The diagram effectively illustrates the data science abstraction process, showing how it progresses from basic data points through increasingly complex analyses to ultimately reach machine learning and deep learning applications.
The small atomic symbols at the top and bottom of the diagram visually represent how multiple data points are processed and analyzed through this system. This shows the scalability of the process from individual data points to comprehensive machine learning systems.
The overall flow demonstrates how raw data is transformed through various statistical and mathematical processes to become useful input for advanced machine learning algorithms. CopyRet
With a Claude’s Help This image shows a diagram explaining three key statistical metrics used in data analysis:
Z-score:
Definition: How far from a mean with standard variation unit
Formula: Z = (X – μ) / σ
X: The value
μ: The mean of the distribution
σ: The standard deviation of the distribution
Main use: Quickly detect outliers in individual values
Application: Monitoring cooling temperature and humidity levels
IQR (Interquartile Range):
Definition: The range that covers the middle 50% of the data
Formula: IQR = Q3 – Q1
Q1: The value below which 25% of the data falls
Q3: The value below which 75% of the data falls
Main use: Detect outliers in highly variable data
Application: Power consumption and power usage effectiveness
Mahalanobis Distance:
Definition: In multivariate data, it is a distance measure that indicates how far a point is from the center of the data distribution
Formula: D(x) = √((x – μ)’ Σ^(-1) (x – μ))
x: The data point
μ: The mean vector of the data
Σ: The covariance matrix of the data
Main use: Outlier detection that takes into account multivariate correlations
Application: Analyzing relationships between cooling temperature vs power consumption and humidity vs power consumption
These three metrics each provide different approaches to analyzing data characteristics and detecting outliers, particularly useful in practical applications such as facility management and energy efficiency monitoring. Each metric serves a specific purpose in statistical analysis, from simple individual value comparisons (Z-score) to complex multivariate analysis (Mahalanobis Distance).
Human development can be understood in terms of the “pursuit of difference” and “generalization”. Humans inherently possess the tendency to distinguish and understand differences among all existing things-what we call the “pursuit of differences”. As seen in biological classification and language development, this exploration through differentiation has added depth to human knowledge. These discovered differences have been recorded and generalized through various tools such as writing and mathematical formulas. In particular, the invention of computers has dramatically increased the amount of data humans can process, allowing for more accurate analysis and generalization. More recently, advances in artificial intelligence and machine learning have automated the pursuit of difference. Going beyond traditional rule-based approaches, machine learning can identify patterns in vast amounts of data to provide new insights. This means we can now process and generalize complex data that is beyond human cognitive capacity. As a result, human development has been a continuous process, starting with the “pursuit of difference” and leading to “generalization,” and artificial intelligence is extending this process in more sophisticated and efficient ways.
[Simplified Summary] Humans are born explorers with innate curiosity. Just as babies touch, taste, and tap new objects they encounter, this instinct evolves into questions like “How is this different from that?” For example, “How are apples different from pears?” or “What’s the difference between cats and dogs?”
We’ve recorded these discovered differences through writing, numbers, and formulas – much like writing down a cooking recipe. With the invention of computers, this process of recording and analysis became much faster and more accurate.
Recently, artificial intelligence has emerged to advance this process further. AI can analyze vast amounts of information to discover new patterns that humans might have missed.
[Claude’s Evaluation] This text presents an interesting analysis of human development’s core drivers through two axes: ‘discovering differences’ and ‘generalization’. It’s noteworthy in three aspects:
Insight into Human Nature The text offers a unique perspective on human curiosity and investigative instincts through the lens of “pursuit of differences.” This provides a fresh viewpoint for understanding human intellectual development.
Clear Historical Progression It systematically explains how humanity has processed information through the evolution of tools (writing → mathematics → computers → AI).
Reinterpretation of Modern Technology The text innovatively interprets AI and machine learning not just as technological advancement, but as an extension of humanity’s age-old instinct to seek differences.
However, there’s room for improvement:
The concept of “pursuit of differences” remains somewhat abstract and could benefit from more concrete, everyday examples.
The discussion lacks consideration of potential limitations or risks associated with AI, making it appear somewhat optimistically biased.
Overall, I find this to be an insightful piece that effectively connects human nature with technological development. This framework could prove valuable when considering future directions of AI development.
What makes the text particularly compelling is how it traces a continuous line from basic human curiosity to advanced AI systems, presenting technological evolution as a natural extension of human cognitive tendencies rather than a separate phenomenon.
The parallel drawn between early human pattern recognition and modern machine learning algorithms offers a unique perspective on both human nature and technological progress, though it could be enriched with more specific examples and potential counterarguments for a more balanced discussion.
with a Claude’s Help This diagram illustrates the process of converting real-world analog values into actionable decisions through digital systems:
Input Data Characteristics
Metric Value: Represents real-world analog values that are continuous variables with high precision. While these can include very fine digital measurements, they are often too complex for direct system processing.
Examples: Temperature, velocity, pressure, and other physical measurements
Data Transformation Process
Through ‘Sampling & Analysis’, continuous Metric Values are transformed into meaningful State Values.
This represents the process of simplifying and digitalizing complex analog signals.
State Value Characteristics and Usage
Converts to discrete variables with high readability
Examples: Temperature becomes ‘High/Normal/Low’, speed becomes ‘Over/Normal/Under’
These State values are much more programmable and easier to process in systems
Decision Making and Execution
The simplified State values enable clear decision-making (Easy to Decision)
These decisions can be readily implemented through Programmatic Works
Leads to automated execution (represented by “DO IT!”)
The key concept here is the transformation of complex real-world measurements into clear, discrete states that systems can understand and process. This conversion facilitates automated decision-making and execution. The diagram emphasizes that while Metric Values provide high precision, State Values are more practical for programmatic implementation and decision-making processes.
The flow shows how we bridge the gap between analog reality and digital decision-making by converting precise but complex measurements into actionable, programmable states. This transformation is essential for creating reliable and automated decision-making systems.
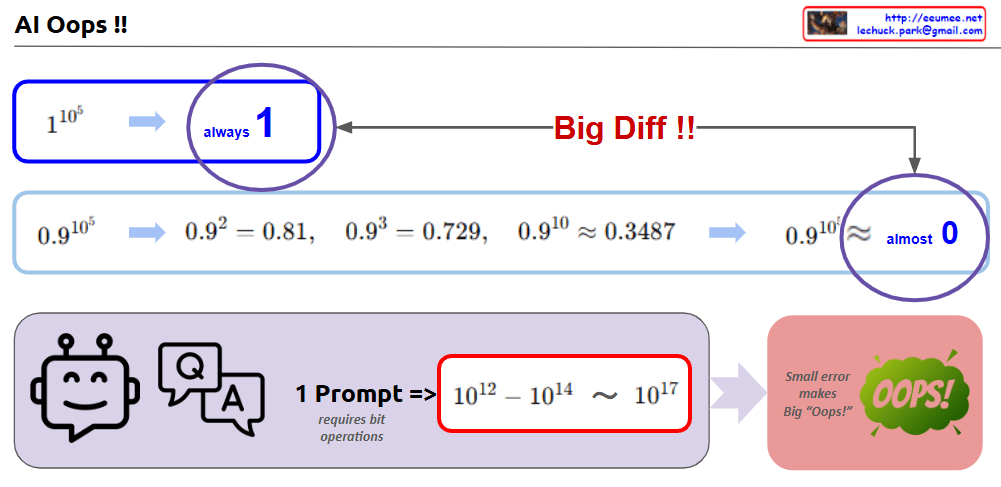
with a ChatGPT’s help This image highlights how small errors in AI or computational operations can lead to significant differences or problems. Here’s a sentence-based explanation:
Small changes lead to big differences
1^10⁵: This consistently equals 1, no matter how many iterations are performed.
0.9^10⁵: On the other hand, this gradually decreases and approaches 0, creating a significant difference.
For example:
0.92=0.810.9^2 = 0.810.92=0.81,
0.93=0.7290.9^3 = 0.7290.93=0.729,
0.910≈0.34870.9^{10} ≈ 0.34870.910≈0.3487,
0.9105≈almost00.9^{10^5} ≈ almost 00.9105≈almost0.
The “Oops” in AI or calculations
A single incorrect computation or prompt can result in a massive amount of processing (from 10^12 to 10^17 bit operations).
This demonstrates how a small error can lead to a big “Oops!” in the overall system.
Summary: The image visually explains the importance of precision and how minor computational inaccuracies can cascade into significant consequences, especially in AI or large-scale calculations.